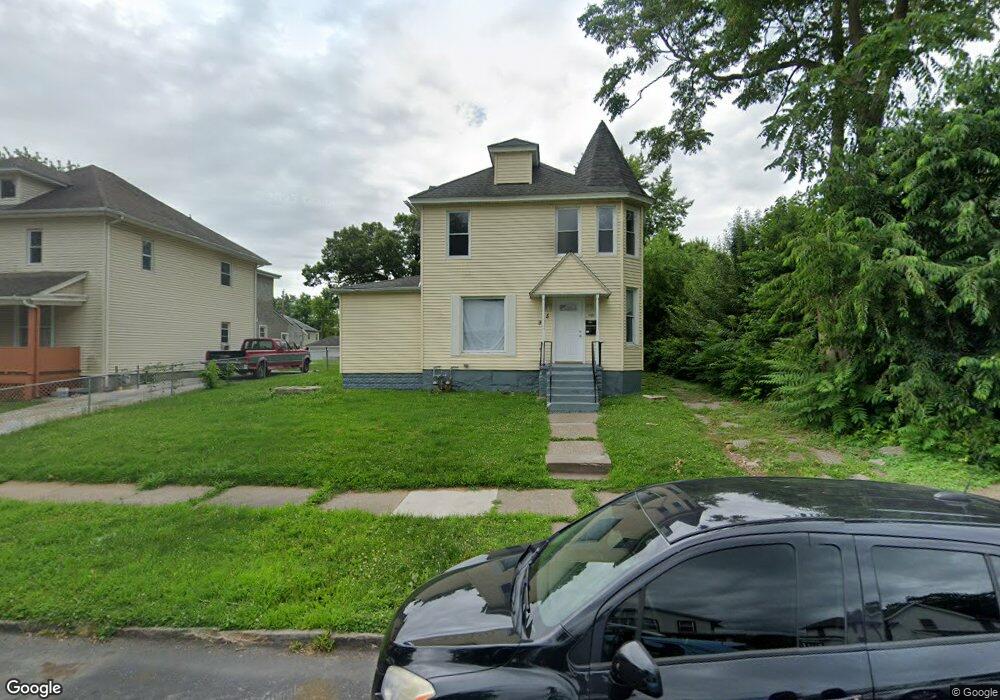
925 E 14th St Unit 2 Davenport, IA 52803
East End NeighborhoodEstimated Value: $98,000 - $105,697
5
Beds
2
Baths
2,590
Sq Ft
$40/Sq Ft
Est. Value
About This Home
This home is located at 925 E 14th St Unit 2, Davenport, IA 52803 and is currently estimated at $102,424, approximately $39 per square foot. 925 E 14th St Unit 2 is a home located in Scott County with nearby schools including McKinley Elementary School, Sudlow Intermediate School, and Central High School.
Ownership History
Date
Name
Owned For
Owner Type
Purchase Details
Closed on
May 15, 2025
Sold by
Best Todd Jeffrey and Foster-Best Amanda
Bought by
Mead Jason
Current Estimated Value
Home Financials for this Owner
Home Financials are based on the most recent Mortgage that was taken out on this home.
Original Mortgage
$75,000
Outstanding Balance
$74,677
Interest Rate
6.81%
Mortgage Type
New Conventional
Estimated Equity
$27,747
Purchase Details
Closed on
Jan 18, 2022
Sold by
Dj Props Llc
Bought by
Birch Properties Llc
Purchase Details
Closed on
Oct 29, 2021
Sold by
Dj Props Llc
Bought by
Best Todd Jeffrey
Home Financials for this Owner
Home Financials are based on the most recent Mortgage that was taken out on this home.
Original Mortgage
$59,925
Interest Rate
3.01%
Mortgage Type
New Conventional
Purchase Details
Closed on
Oct 12, 2012
Sold by
Cubbin Kenneth A and Cubbin Brenda I
Bought by
Jbb Enterprises Llc
Purchase Details
Closed on
May 7, 2007
Sold by
Persike Properties Llc
Bought by
Cubbin Kenneth A and Cubbin Brenda I
Home Financials for this Owner
Home Financials are based on the most recent Mortgage that was taken out on this home.
Original Mortgage
$65,600
Interest Rate
5.96%
Mortgage Type
Purchase Money Mortgage
Create a Home Valuation Report for This Property
The Home Valuation Report is an in-depth analysis detailing your home's value as well as a comparison with similar homes in the area
Home Values in the Area
Average Home Value in this Area
Purchase History
| Date | Buyer | Sale Price | Title Company |
|---|---|---|---|
| Mead Jason | $100,000 | None Listed On Document | |
| Birch Properties Llc | $89,000 | None Listed On Document | |
| Best Todd Jeffrey | $80,000 | None Available | |
| Jbb Enterprises Llc | $67,500 | None Available | |
| Cubbin Kenneth A | $82,000 | None Available |
Source: Public Records
Mortgage History
| Date | Status | Borrower | Loan Amount |
|---|---|---|---|
| Open | Mead Jason | $75,000 | |
| Previous Owner | Best Todd Jeffrey | $59,925 | |
| Previous Owner | Cubbin Kenneth A | $65,600 |
Source: Public Records
Tax History Compared to Growth
Tax History
| Year | Tax Paid | Tax Assessment Tax Assessment Total Assessment is a certain percentage of the fair market value that is determined by local assessors to be the total taxable value of land and additions on the property. | Land | Improvement |
|---|---|---|---|---|
| 2025 | $1,782 | $99,700 | $22,570 | $77,130 |
| 2024 | $1,738 | $99,700 | $22,570 | $77,130 |
| 2023 | $1,905 | $99,700 | $22,570 | $77,130 |
| 2022 | $2,031 | $87,060 | $12,250 | $74,810 |
| 2021 | $1,868 | $87,060 | $12,250 | $74,810 |
| 2020 | $2,320 | $77,300 | $12,250 | $65,050 |
| 2019 | $1,812 | $66,460 | $12,250 | $54,210 |
| 2018 | $2,573 | $66,460 | $12,250 | $54,210 |
| 2017 | $1,388 | $63,750 | $12,250 | $51,500 |
| 2016 | $1,681 | $61,040 | $0 | $0 |
| 2015 | $1,336 | $67,160 | $0 | $0 |
| 2014 | $1,492 | $67,160 | $0 | $0 |
| 2013 | $1,466 | $0 | $0 | $0 |
| 2012 | -- | $77,160 | $12,710 | $64,450 |
Source: Public Records
Map
Nearby Homes
- 1020 E 15th St
- 924 Kirkwood Blvd
- 916 Kirkwood Blvd
- 1207 Tremont Ave
- 1134 Tremont Ave
- 1501 Bridge Ave
- 637 E 15th St
- 1220 College Ave
- 1224 E 11th St
- 1012 Bridge Ave
- 1102 College Ave
- 1215 Farnam St
- 1920 Carey Ave
- 1616 Esplanade Ave
- 618 Douglas Ct
- 11 Oak Ln
- 1004 College Ave
- 1323 Leclaire St
- 409 E 14th St
- 420 Kirkwood Blvd
- 921 E 14th St
- 1003 E 14th St
- 915 E 14th St
- 1007 E 14th St
- 0 E 14th St
- 909 E 14th St
- 1013 E 14th St
- 930 E 13th St
- 922 E 13th St
- 918 E 13th St
- 1327 Arlington Ave
- 920 E 14th St
- 922 E 14th St
- 1315 Arlington Ave
- 918 E 14th St
- 1311 Arlington Ave
- 1019 E 14th St
- 1006 E 14th St
- 1010 E 14th St
- 1305 Arlington Ave