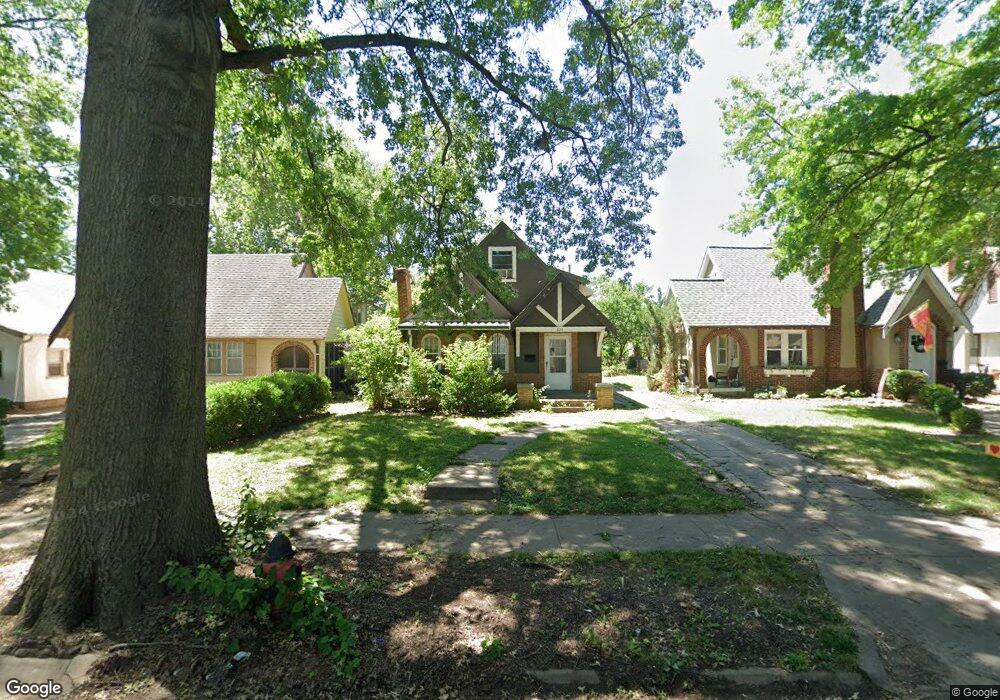
925 E 76th Terrace Kansas City, MO 64131
Waldo NeighborhoodEstimated Value: $198,103 - $251,000
2
Beds
1
Bath
1,477
Sq Ft
$153/Sq Ft
Est. Value
About This Home
This home is located at 925 E 76th Terrace, Kansas City, MO 64131 and is currently estimated at $226,276, approximately $153 per square foot. 925 E 76th Terrace is a home located in Jackson County with nearby schools including John T. Hartman Elementary School, Central Middle School, and Southeast High School.
Ownership History
Date
Name
Owned For
Owner Type
Purchase Details
Closed on
Aug 21, 2012
Sold by
Heiman Properties Llc
Bought by
Quality Custom Properties Llc
Current Estimated Value
Purchase Details
Closed on
Jun 29, 2011
Sold by
Commerce Bank
Bought by
Heiman Properties Llc
Purchase Details
Closed on
Dec 7, 2010
Sold by
Hickmott Brandy A and Hickmott Jeffrey C
Bought by
Commerce Bank N A
Purchase Details
Closed on
Feb 14, 2007
Sold by
English Tanya R
Bought by
Hickmott Jeffrey C and Hickmott Brandy A
Home Financials for this Owner
Home Financials are based on the most recent Mortgage that was taken out on this home.
Original Mortgage
$98,000
Interest Rate
6.17%
Mortgage Type
Purchase Money Mortgage
Purchase Details
Closed on
Mar 9, 1997
Sold by
Zaroor Joseph and Zaroor Joseph P
Bought by
Hollingsworth Joan
Create a Home Valuation Report for This Property
The Home Valuation Report is an in-depth analysis detailing your home's value as well as a comparison with similar homes in the area
Home Values in the Area
Average Home Value in this Area
Purchase History
| Date | Buyer | Sale Price | Title Company |
|---|---|---|---|
| Quality Custom Properties Llc | -- | Kansas City Title Inc | |
| Heiman Properties Llc | -- | Continental Title | |
| Commerce Bank N A | $79,561 | None Available | |
| Hickmott Jeffrey C | -- | Kansas City Title | |
| Hollingsworth Joan | -- | Security Land Title Company |
Source: Public Records
Mortgage History
| Date | Status | Borrower | Loan Amount |
|---|---|---|---|
| Previous Owner | Hickmott Jeffrey C | $98,000 |
Source: Public Records
Tax History Compared to Growth
Tax History
| Year | Tax Paid | Tax Assessment Tax Assessment Total Assessment is a certain percentage of the fair market value that is determined by local assessors to be the total taxable value of land and additions on the property. | Land | Improvement |
|---|---|---|---|---|
| 2025 | $2,815 | $33,419 | $4,718 | $28,701 |
| 2024 | $2,789 | $35,669 | $3,500 | $32,169 |
| 2023 | $2,789 | $35,669 | $4,140 | $31,529 |
| 2022 | $2,079 | $25,270 | $4,418 | $20,852 |
| 2021 | $2,072 | $25,270 | $4,418 | $20,852 |
| 2020 | $1,847 | $22,244 | $4,418 | $17,826 |
| 2019 | $1,808 | $22,244 | $4,418 | $17,826 |
| 2018 | $1,641 | $20,620 | $2,211 | $18,409 |
| 2017 | $1,609 | $20,620 | $2,211 | $18,409 |
| 2016 | $1,609 | $20,104 | $2,319 | $17,785 |
| 2014 | -- | $19,710 | $2,274 | $17,436 |
Source: Public Records
Map
Nearby Homes
- 917 E 77th St
- 1010 E 76th St
- 1122 E 76th St
- 7634 Charlotte St
- 928 E 78th St
- 800 - 802 E 75th Terrace
- 7514 Harrison St
- 7617 Holmes Rd
- 7615 Holmes Rd
- 825 E 75th St
- 1150 E 75th Terrace
- 7709 Kenwood Ave
- 7713 Kenwood Ave
- 7719 Kenwood Ave
- 7840 Campbell St
- 7406 Tracy Ave
- 1415 E 76th Terrace
- 1400 E 77th Terrace
- 7613 Locust St
- 507 E 75th St
- 927 E 76th Terrace
- 921 E 76th Terrace
- 929 E 76th Terrace
- 917 E 76th Terrace
- 933 E 76th Terrace
- 915 E 76th Terrace
- 920 E 77th St
- 924 E 76th Terrace
- 911 E 76th Terrace
- 928 E 76th Terrace
- 916 E 77th St
- 918 E 76th Terrace
- 930 E 76th Terrace
- 914 E 76th Terrace
- 926 E 77th St
- 920 E 76th Terrace
- 907 E 76th Terrace
- 930 E 77th St
- 934 E 76th Terrace
- 912 E 76th Terrace