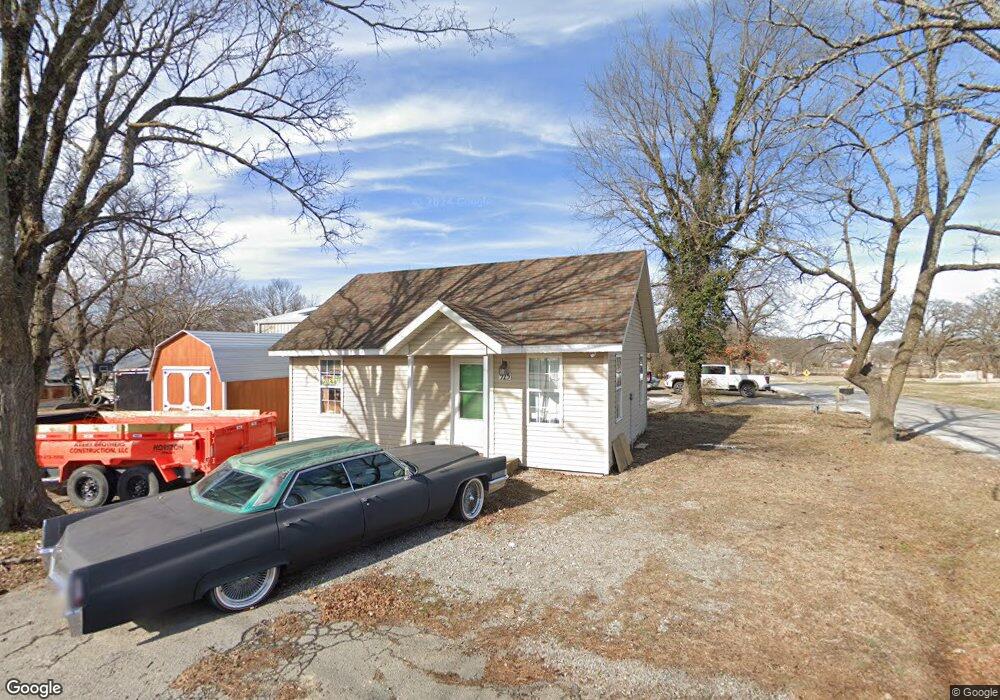
925 E Cornell St Siloam Springs, AR 72761
Estimated Value: $36,815
--
Bed
1
Bath
616
Sq Ft
$60/Sq Ft
Est. Value
About This Home
This home is located at 925 E Cornell St, Siloam Springs, AR 72761 and is currently estimated at $36,815, approximately $59 per square foot. 925 E Cornell St is a home located in Benton County with nearby schools including Northside Elementary School, Delbert Pete & Pat Allen Elementary School, and Southside Elementary School.
Ownership History
Date
Name
Owned For
Owner Type
Purchase Details
Closed on
Apr 4, 2024
Sold by
James Roy D and James Rebecca F
Bought by
Avery Ricky Len
Current Estimated Value
Purchase Details
Closed on
Mar 15, 2013
Sold by
Decatur State Bank
Bought by
James Roy D and James Rebecca F
Purchase Details
Closed on
Aug 29, 2003
Bought by
Pitner
Purchase Details
Closed on
Mar 29, 2002
Bought by
Kittle
Purchase Details
Closed on
Apr 25, 2001
Bought by
Kelly Tr E
Purchase Details
Closed on
Apr 16, 2001
Bought by
Kelly Rev Trust
Purchase Details
Closed on
Mar 2, 2001
Bought by
Dod 03-02-2001
Purchase Details
Closed on
Feb 25, 1998
Bought by
Kelly and Kelly
Purchase Details
Closed on
Sep 26, 1995
Bought by
Kelly
Purchase Details
Closed on
Mar 13, 1995
Bought by
Blaine
Purchase Details
Closed on
Mar 8, 1995
Bought by
N and A
Purchase Details
Closed on
Apr 1, 1993
Bought by
Kelly
Create a Home Valuation Report for This Property
The Home Valuation Report is an in-depth analysis detailing your home's value as well as a comparison with similar homes in the area
Home Values in the Area
Average Home Value in this Area
Purchase History
| Date | Buyer | Sale Price | Title Company |
|---|---|---|---|
| Avery Ricky Len | $34,000 | None Listed On Document | |
| James Roy D | $34,000 | Rtc | |
| Pitner | $13,000 | -- | |
| Kittle | $18,000 | -- | |
| Kelly Tr | -- | -- | |
| Kelly Tr E | -- | -- | |
| Kelly Rev Trust | -- | -- | |
| Dod 03-02-2001 | -- | -- | |
| Kelly | -- | -- | |
| Kelly | -- | -- | |
| Blaine | $20,000 | -- | |
| N | -- | -- | |
| Kelly | -- | -- | |
| Fox | -- | -- |
Source: Public Records
Tax History Compared to Growth
Tax History
| Year | Tax Paid | Tax Assessment Tax Assessment Total Assessment is a certain percentage of the fair market value that is determined by local assessors to be the total taxable value of land and additions on the property. | Land | Improvement |
|---|---|---|---|---|
| 2025 | $802 | $14,285 | $3,006 | $11,279 |
| 2024 | $629 | $14,285 | $3,006 | $11,279 |
| 2023 | $572 | $9,930 | $2,960 | $6,970 |
| 2022 | $571 | $9,930 | $2,960 | $6,970 |
| 2021 | $570 | $9,930 | $2,960 | $6,970 |
| 2020 | $547 | $9,490 | $2,960 | $6,530 |
| 2019 | $547 | $9,490 | $2,960 | $6,530 |
| 2018 | $547 | $9,490 | $2,960 | $6,530 |
| 2017 | $366 | $6,890 | $5,600 | $1,290 |
| 2016 | $366 | $6,890 | $5,600 | $1,290 |
| 2015 | $333 | $5,780 | $1,600 | $4,180 |
| 2014 | $333 | $5,780 | $1,600 | $4,180 |
Source: Public Records
Map
Nearby Homes
- 800 Meghan St
- 110 N Gunter St
- 517 N Madison St
- 1107 A&B Hico St
- 0 Tbd St Andrews
- 506 E Ashley St
- 403 E University St
- 414 N Maxwell St
- 101 E Central St
- 908 Willow Ct
- 210 E Ashley St
- 111 E Helena St
- 716 N Mount Olive St
- TBD Cheri Whitlock
- 605 N Wright St
- 503 N Wright St
- 1.94 AC Lot 2 S Britt St
- 4.94 AC Lots 1 & 2 S Britt St
- 3 AC Lot 1 S Britt St
- 607 E Delaware St
- 510 N Hico St
- 500 N Hico St
- 612 N Hico St
- 905 E Cornell St
- 609 Gunter St
- 611 Gunter St
- 0 On N Hico St Unit 598884
- Tbd N Hico St
- 0 N Gunter Unit 619470
- 612 Gunter St
- 0 E Tahlequah St Unit 1235834
- 0 E Tahlequah St Unit 604633
- 0 E Tahlequah St Unit 690833
- 0 E Tahlequah St Unit 736108
- 1005 E Tahlequah St
- 700 N Gunter St
- 706 E Franklin St
- 1103 E Tahlequah St
- 712 E Helena St
- 704 E Franklin St