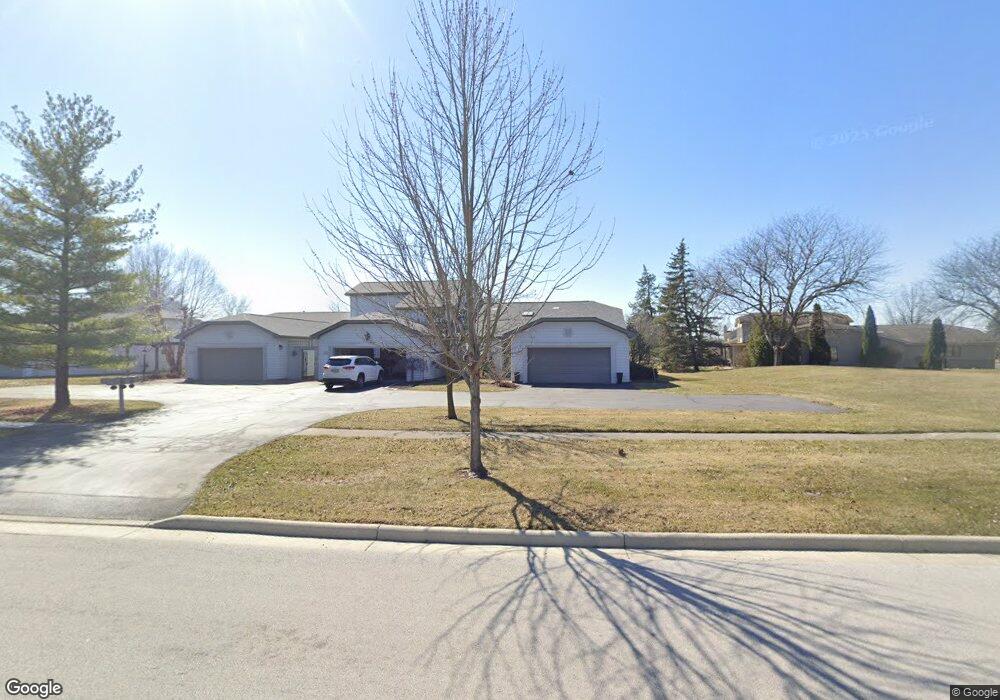
925 Fox Run Rd Unit 1 Findlay, OH 45840
Estimated Value: $230,476 - $286,000
2
Beds
2
Baths
1,516
Sq Ft
$168/Sq Ft
Est. Value
About This Home
This home is located at 925 Fox Run Rd Unit 1, Findlay, OH 45840 and is currently estimated at $254,619, approximately $167 per square foot. 925 Fox Run Rd Unit 1 is a home located in Hancock County with nearby schools including Wilson Vance Elementary School, Whittier Elementary School, and Glenwood Middle School.
Ownership History
Date
Name
Owned For
Owner Type
Purchase Details
Closed on
Nov 30, 2016
Sold by
Principle Holdings Llc
Bought by
Pendley Marsha L
Current Estimated Value
Purchase Details
Closed on
Mar 3, 2016
Bought by
Marsha L Pendley
Purchase Details
Closed on
Aug 23, 2006
Sold by
Weir Ruth E
Bought by
Principle Holdings Llc
Home Financials for this Owner
Home Financials are based on the most recent Mortgage that was taken out on this home.
Original Mortgage
$170,000
Interest Rate
6.78%
Mortgage Type
Purchase Money Mortgage
Purchase Details
Closed on
Apr 28, 1983
Bought by
Weir Ruth E
Purchase Details
Closed on
Apr 26, 1983
Bought by
Country Club Acres Inc
Create a Home Valuation Report for This Property
The Home Valuation Report is an in-depth analysis detailing your home's value as well as a comparison with similar homes in the area
Home Values in the Area
Average Home Value in this Area
Purchase History
| Date | Buyer | Sale Price | Title Company |
|---|---|---|---|
| Pendley Marsha L | $193,000 | Golden Key Title Agency | |
| Marsha L Pendley | -- | -- | |
| Principle Holdings Llc | $170,000 | Hancock Title | |
| Weir Ruth E | $82,500 | -- | |
| Country Club Acres Inc | -- | -- |
Source: Public Records
Mortgage History
| Date | Status | Borrower | Loan Amount |
|---|---|---|---|
| Previous Owner | Principle Holdings Llc | $170,000 |
Source: Public Records
Tax History
| Year | Tax Paid | Tax Assessment Tax Assessment Total Assessment is a certain percentage of the fair market value that is determined by local assessors to be the total taxable value of land and additions on the property. | Land | Improvement |
|---|---|---|---|---|
| 2024 | $2,185 | $61,510 | $3,680 | $57,830 |
| 2023 | $2,188 | $61,510 | $3,680 | $57,830 |
| 2022 | $2,181 | $61,510 | $3,680 | $57,830 |
| 2021 | $2,176 | $53,460 | $2,800 | $50,660 |
| 2020 | $2,176 | $53,460 | $2,800 | $50,660 |
| 2019 | $2,134 | $53,460 | $2,800 | $50,660 |
| 2018 | $2,004 | $46,100 | $2,800 | $43,300 |
| 2017 | $2,004 | $46,100 | $2,800 | $43,300 |
| 2016 | $2,033 | $46,100 | $2,800 | $43,300 |
| 2015 | $1,917 | $42,620 | $2,800 | $39,820 |
| 2014 | $1,917 | $42,620 | $2,800 | $39,820 |
| 2012 | $2,047 | $45,160 | $2,800 | $42,360 |
Source: Public Records
Map
Nearby Homes
- 845 Fox Run Rd
- 821 Fox Run Rd Unit 6
- 801 Fox Run Rd
- 2245 Fox Run Cir Unit 1037
- 1121 Fox Run Rd
- 701 Red Fox Rd
- 827 Abbey Ln
- 456 Strathaven Dr
- 2000 Rush Creek Ct
- 1926 Queenswood Dr
- 1203 Chateau Ct
- 1825 Greendale Ave
- 8131 Brookfield Cir
- 15329 E Us Route 224
- 1828 Queenswood Dr
- 8457 Lakewood Dr
- 2143 Bluestone Dr
- 0 E Us Route 224
- 1724 Queenswood Dr Unit 10 (2-C)
- 631 Winterhaven Dr
- 927 Fox Run Rd
- 929 Fox Run Rd Unit U3
- 1001 Fox Run Rd Unit 4
- 1003 Fox Run Rd
- 917 Fox Run Rd
- 1005 Fox Run Rd Unit U6
- 915 Fox Run Rd Unit 14
- 2301 Foxfire Ln
- 909 Fox Run Rd
- 2300 Foxbury Ln
- 907 Fox Run Rd Unit 12
- 910 Fox Run Rd
- 911 Fox Run Rd
- 1011 Fox Run Rd
- 1013 Fox Run Rd
- 905 Fox Run Rd Unit U11
- 2309 Foxfire Ln
- 903 Fox Run Rd
- 2310 Foxbury Ln
- 867 Fox Run Rd
Your Personal Tour Guide
Ask me questions while you tour the home.