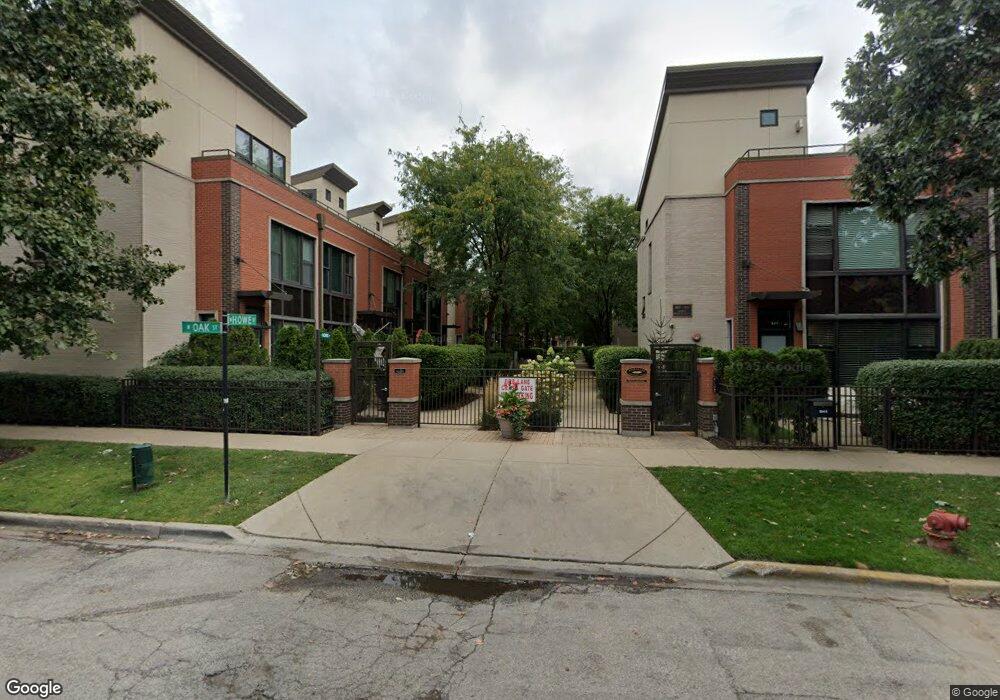
925 N Howe St Unit GU21 Chicago, IL 60610
Goose Island NeighborhoodEstimated Value: $195,616 - $560,000
2
Beds
3
Baths
1,300
Sq Ft
$349/Sq Ft
Est. Value
About This Home
This home is located at 925 N Howe St Unit GU21, Chicago, IL 60610 and is currently estimated at $454,154, approximately $349 per square foot. 925 N Howe St Unit GU21 is a home located in Cook County with nearby schools including Ogden Elementary School, Lincoln Park High School, and The Noble Academy.
Ownership History
Date
Name
Owned For
Owner Type
Purchase Details
Closed on
Jan 27, 2017
Sold by
Steinberg Andrew and Steinberg Jennifer
Bought by
Wade Michael C and Wade Monica C
Current Estimated Value
Home Financials for this Owner
Home Financials are based on the most recent Mortgage that was taken out on this home.
Original Mortgage
$307,800
Outstanding Balance
$252,747
Interest Rate
4.25%
Mortgage Type
New Conventional
Estimated Equity
$201,407
Purchase Details
Closed on
Feb 25, 2010
Sold by
Paine Kristen Nicole and Steinberg Andrew William
Bought by
Steinberg Andrew William
Home Financials for this Owner
Home Financials are based on the most recent Mortgage that was taken out on this home.
Original Mortgage
$386,192
Interest Rate
5.03%
Mortgage Type
FHA
Purchase Details
Closed on
Jan 12, 2006
Sold by
River Village Townhomes South Llc
Bought by
Steinberg Andrew William and Steinberg Kristen Nicole
Create a Home Valuation Report for This Property
The Home Valuation Report is an in-depth analysis detailing your home's value as well as a comparison with similar homes in the area
Home Values in the Area
Average Home Value in this Area
Purchase History
| Date | Buyer | Sale Price | Title Company |
|---|---|---|---|
| Wade Michael C | $410,500 | Attorney | |
| Steinberg Andrew William | -- | None Available | |
| Steinberg Andrew William | $402,500 | Multiple |
Source: Public Records
Mortgage History
| Date | Status | Borrower | Loan Amount |
|---|---|---|---|
| Open | Wade Michael C | $307,800 | |
| Previous Owner | Steinberg Andrew William | $386,192 |
Source: Public Records
Tax History
| Year | Tax Paid | Tax Assessment Tax Assessment Total Assessment is a certain percentage of the fair market value that is determined by local assessors to be the total taxable value of land and additions on the property. | Land | Improvement |
|---|---|---|---|---|
| 2025 | $601 | $3,478 | $1,089 | $2,389 |
| 2024 | $601 | $3,478 | $1,089 | $2,389 |
| 2023 | $586 | $2,848 | $500 | $2,348 |
| 2022 | $586 | $2,848 | $500 | $2,348 |
| 2021 | $573 | $2,847 | $500 | $2,347 |
| 2020 | $598 | $2,684 | $843 | $1,841 |
| 2019 | $588 | $2,927 | $843 | $2,084 |
| 2018 | $578 | $2,927 | $843 | $2,084 |
| 2017 | $479 | $2,223 | $667 | $1,556 |
| 2016 | $445 | $2,223 | $667 | $1,556 |
| 2015 | $407 | $2,223 | $667 | $1,556 |
| 2014 | $347 | $1,868 | $505 | $1,363 |
| 2013 | $340 | $1,868 | $505 | $1,363 |
Source: Public Records
Map
Nearby Homes
- 900 N Kingsbury St Unit 812
- 900 N Kingsbury St Unit 821
- 900 N Kingsbury St Unit 835
- 900 N Kingsbury St Unit 716
- 900 N Kingsbury St Unit P160
- 900 N Kingsbury St Unit 780
- 1000 N Kingsbury St Unit 107
- 845 N Kingsbury St Unit 211
- 845 N Kingsbury St Unit 515
- 1009 N Riverwalk St
- 925 N Larrabee St Unit 2N
- 873 N Larrabee St Unit 509
- 873 N Larrabee St Unit 605
- 1036 N Crosby St
- 758 N Larrabee St Unit 411
- 758 N Larrabee St Unit 408
- 758 N Larrabee St Unit 514
- 758 N Larrabee St Unit 509
- 758 N Larrabee St Unit 519
- 500 W Superior St Unit 1202
- 925 N Howe St
- 923 N Howe St Unit 923H
- 929 N Howe St Unit 929H
- 921 N Howe St Unit 921H
- 623 W Oak St
- 623 W Oak St
- 623 W Oak St
- 968 N Crosby St
- 968 N Crosby St
- 968 N Crosby St
- 949 N Crosby St Unit H
- 906 N Kingsbury St
- 912 N Kingsbury St
- 916 N Kingsbury St
- 924 N Kingsbury St
- 926 N Kingsbury St
- 936 N Kingsbury St
- 938 N Kingsbury St
- 940 N Kingsbury St
- 944 N Kingsbury St
Your Personal Tour Guide
Ask me questions while you tour the home.