925 S 7th St Unit Cross St. Lander, WY 82520
Estimated Value: $622,219 - $717,000
5
Beds
3
Baths
2,534
Sq Ft
$260/Sq Ft
Est. Value
About This Home
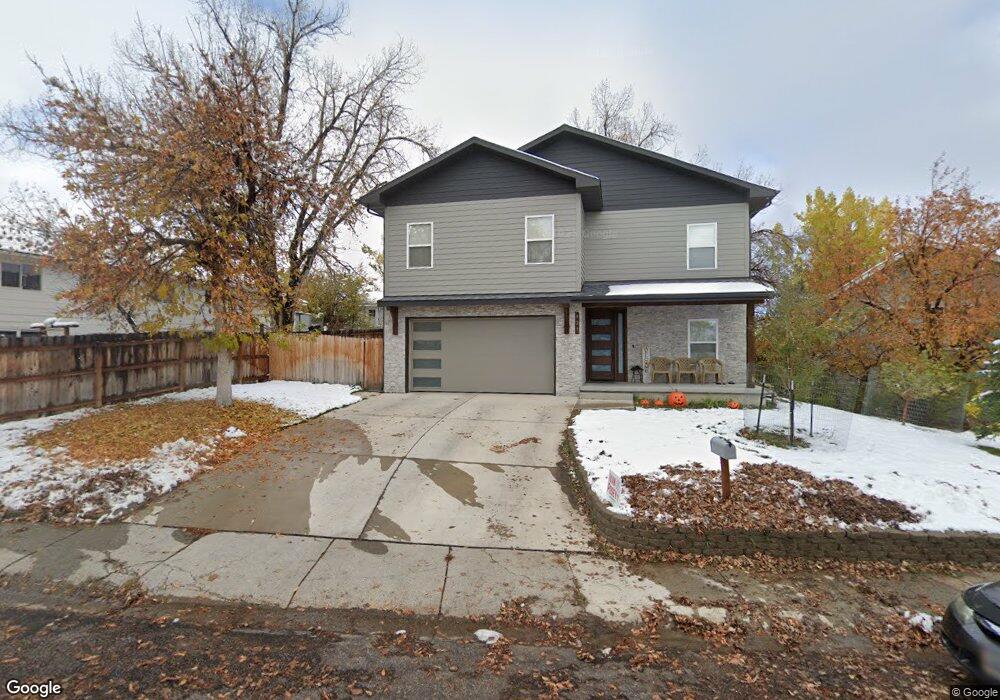
This home is located at 925 S 7th St Unit Cross St., Lander, WY 82520 and is currently estimated at $658,073, approximately $259 per square foot. 925 S 7th St Unit Cross St. is a home located in Fremont County with nearby schools including Lander Valley High School and Lander Christian Academy.
Ownership History
Date
Name
Owned For
Owner Type
Purchase Details
Closed on
Aug 12, 2022
Sold by
Baures Eric J and Baures Lauren L
Bought by
Mccann Sage
Current Estimated Value
Home Financials for this Owner
Home Financials are based on the most recent Mortgage that was taken out on this home.
Original Mortgage
$545,606
Outstanding Balance
$522,404
Interest Rate
5.7%
Mortgage Type
VA
Estimated Equity
$135,669
Purchase Details
Closed on
Jul 27, 2021
Sold by
Carrera Edmund R and Carrera Claudine
Bought by
Baures Eric J and Baures Lauren L
Home Financials for this Owner
Home Financials are based on the most recent Mortgage that was taken out on this home.
Original Mortgage
$460,275
Interest Rate
2.93%
Mortgage Type
New Conventional
Purchase Details
Closed on
Feb 17, 2021
Sold by
Capisce Lp
Bought by
Carrera Edmund R and Carrera Claudine
Purchase Details
Closed on
Aug 16, 2019
Sold by
Kaufman L Brent and Kaufman Deborah B
Bought by
Capisce Lp
Create a Home Valuation Report for This Property
The Home Valuation Report is an in-depth analysis detailing your home's value as well as a comparison with similar homes in the area
Home Values in the Area
Average Home Value in this Area
Purchase History
| Date | Buyer | Sale Price | Title Company |
|---|---|---|---|
| Mccann Sage | -- | None Listed On Document | |
| Baures Eric J | -- | None Listed On Document | |
| Carrera Edmund R | -- | None Listed On Document | |
| Capisce Lp | -- | None Available |
Source: Public Records
Mortgage History
| Date | Status | Borrower | Loan Amount |
|---|---|---|---|
| Open | Mccann Sage | $545,606 | |
| Previous Owner | Baures Eric J | $460,275 |
Source: Public Records
Tax History Compared to Growth
Tax History
| Year | Tax Paid | Tax Assessment Tax Assessment Total Assessment is a certain percentage of the fair market value that is determined by local assessors to be the total taxable value of land and additions on the property. | Land | Improvement |
|---|---|---|---|---|
| 2025 | $4,800 | $48,343 | $4,032 | $44,311 |
| 2024 | $4,800 | $62,186 | $5,376 | $56,810 |
| 2023 | $4,553 | $59,461 | $4,836 | $54,625 |
| 2022 | $3,792 | $50,622 | $4,836 | $45,786 |
| 2021 | $3,918 | $43,387 | $4,655 | $38,732 |
| 2020 | $369 | $4,770 | $4,655 | $115 |
| 2019 | $374 | $4,769 | $4,643 | $126 |
| 2018 | $379 | $4,773 | $4,643 | $130 |
| 2017 | $380 | $4,779 | $4,643 | $136 |
| 2016 | $369 | $4,643 | $4,643 | $0 |
| 2015 | $1,843 | $4,643 | $4,643 | $0 |
| 2014 | $1,843 | $4,643 | $4,643 | $0 |
Source: Public Records
Map
Nearby Homes