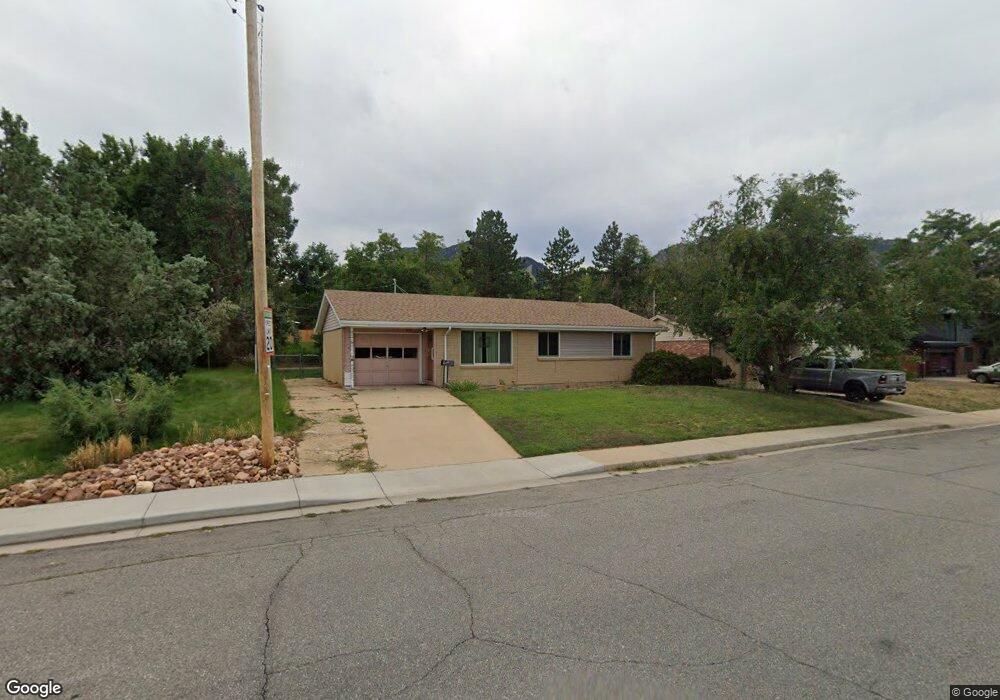
925 Yale Rd Boulder, CO 80305
Table Mesa NeighborhoodEstimated Value: $932,000 - $1,155,000
2
Beds
1
Bath
1,026
Sq Ft
$1,009/Sq Ft
Est. Value
About This Home
This home is located at 925 Yale Rd, Boulder, CO 80305 and is currently estimated at $1,035,451, approximately $1,009 per square foot. 925 Yale Rd is a home located in Boulder County with nearby schools including Bear Creek Elementary School, Mesa Elementary School, and Southern Hills Middle School.
Ownership History
Date
Name
Owned For
Owner Type
Purchase Details
Closed on
Jul 18, 2016
Sold by
Zook Robin S
Bought by
Zook Robin S
Current Estimated Value
Purchase Details
Closed on
Sep 11, 2015
Sold by
Zook Christopher Michael
Bought by
Zook Robin S
Home Financials for this Owner
Home Financials are based on the most recent Mortgage that was taken out on this home.
Original Mortgage
$250,000
Interest Rate
3.97%
Mortgage Type
Unknown
Purchase Details
Closed on
Nov 23, 1998
Sold by
Sparling Aileene A and Sparling William E
Bought by
Sparling Aileen A
Purchase Details
Closed on
Dec 13, 1996
Sold by
Sparling Aileene A
Bought by
Sparling Aileene A
Purchase Details
Closed on
Jun 28, 1963
Bought by
Zook Robin S and Zook Christopher Michael
Create a Home Valuation Report for This Property
The Home Valuation Report is an in-depth analysis detailing your home's value as well as a comparison with similar homes in the area
Home Values in the Area
Average Home Value in this Area
Purchase History
| Date | Buyer | Sale Price | Title Company |
|---|---|---|---|
| Zook Robin S | -- | None Available | |
| Zook Robin S | -- | Heritage Title Co | |
| Sparling Aileen A | -- | -- | |
| Sparling Aileene A | -- | -- | |
| Zook Robin S | -- | -- |
Source: Public Records
Mortgage History
| Date | Status | Borrower | Loan Amount |
|---|---|---|---|
| Closed | Zook Robin S | $250,000 |
Source: Public Records
Tax History Compared to Growth
Tax History
| Year | Tax Paid | Tax Assessment Tax Assessment Total Assessment is a certain percentage of the fair market value that is determined by local assessors to be the total taxable value of land and additions on the property. | Land | Improvement |
|---|---|---|---|---|
| 2025 | $5,639 | $60,388 | $54,349 | $6,039 |
| 2024 | $5,639 | $60,388 | $54,349 | $6,039 |
| 2023 | $5,541 | $64,159 | $61,060 | $6,784 |
| 2022 | $4,868 | $52,423 | $47,181 | $5,242 |
| 2021 | $4,642 | $53,932 | $48,539 | $5,393 |
| 2020 | $4,154 | $47,726 | $38,181 | $9,545 |
| 2019 | $4,091 | $47,726 | $38,181 | $9,545 |
| 2018 | $4,020 | $46,361 | $34,200 | $12,161 |
| 2017 | $3,894 | $51,254 | $37,810 | $13,444 |
| 2016 | $3,384 | $39,092 | $27,542 | $11,550 |
| 2015 | $2,552 | $32,954 | $14,885 | $18,069 |
| 2014 | $2,149 | $32,954 | $14,885 | $18,069 |
Source: Public Records
Map
Nearby Homes
- 2860 Table Mesa Dr
- 1120 Hartford Dr
- 1265 Hartford Dr
- 2880 La Grange Cir
- 2955 Stanford Ave
- 1395 Drexel St
- 3450 Emerson Ave
- 960 Toedtli Dr
- 4350 Butler Cir
- 2585 Kohler Dr
- 1535 Findlay Way
- 450 S 40th St
- 2235 Vassar Dr
- 3410 Heidelberg Dr
- 450 S 41st St
- 3310 Heidelberg Dr
- 725 S 45th St
- 4475 Hastings Dr
- 140 S Lashley Ln
- 2100 Kohler Dr