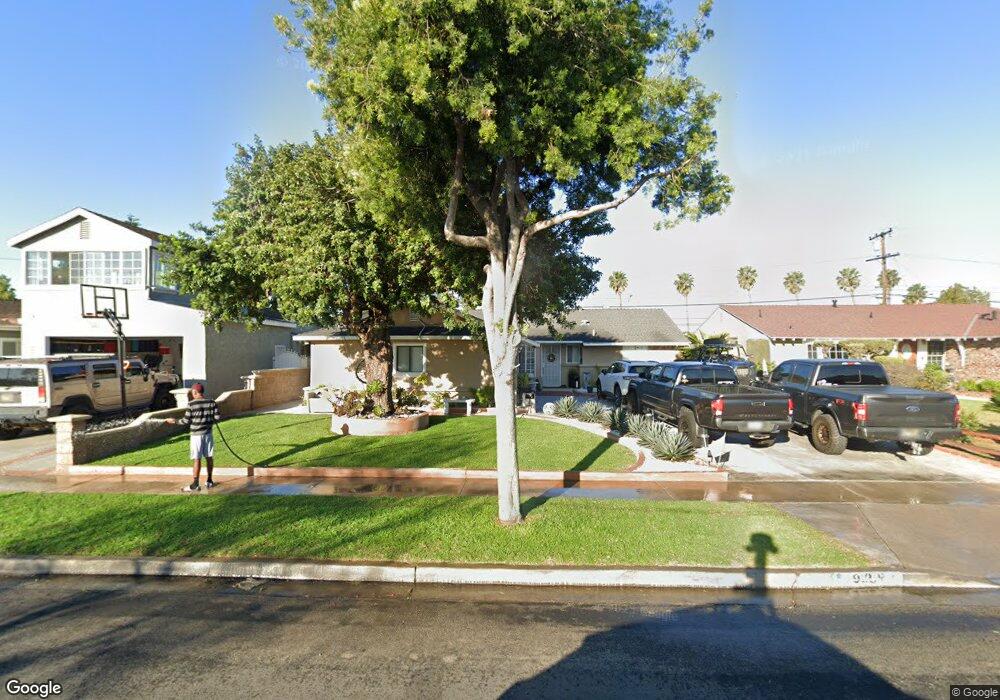
9251 Via Balboa Cir Buena Park, CA 90620
Estimated Value: $838,577 - $1,131,000
3
Beds
2
Baths
1,130
Sq Ft
$823/Sq Ft
Est. Value
About This Home
This home is located at 9251 Via Balboa Cir, Buena Park, CA 90620 and is currently estimated at $929,894, approximately $822 per square foot. 9251 Via Balboa Cir is a home located in Orange County with nearby schools including San Marino Elementary School, Orangeview Junior High, and Western High School.
Ownership History
Date
Name
Owned For
Owner Type
Purchase Details
Closed on
Oct 31, 2012
Sold by
Singh Jagjit and Pal Tara
Bought by
Singh Jagjit and Singh Sashi P
Current Estimated Value
Home Financials for this Owner
Home Financials are based on the most recent Mortgage that was taken out on this home.
Original Mortgage
$138,000
Outstanding Balance
$24,454
Interest Rate
3.35%
Mortgage Type
New Conventional
Estimated Equity
$905,440
Purchase Details
Closed on
Nov 15, 1996
Sold by
Singh Sashi
Bought by
Singh Jagjit
Purchase Details
Closed on
Feb 11, 1995
Sold by
Gramata Mary Anna
Bought by
Singh Jagjit and Pal Tara
Home Financials for this Owner
Home Financials are based on the most recent Mortgage that was taken out on this home.
Original Mortgage
$157,700
Interest Rate
9.03%
Create a Home Valuation Report for This Property
The Home Valuation Report is an in-depth analysis detailing your home's value as well as a comparison with similar homes in the area
Home Values in the Area
Average Home Value in this Area
Purchase History
| Date | Buyer | Sale Price | Title Company |
|---|---|---|---|
| Singh Jagjit | -- | Servicelink | |
| Singh Jagjit | -- | California Counties Title Co | |
| Singh Jagjit | $166,000 | -- |
Source: Public Records
Mortgage History
| Date | Status | Borrower | Loan Amount |
|---|---|---|---|
| Open | Singh Jagjit | $138,000 | |
| Previous Owner | Singh Jagjit | $157,700 |
Source: Public Records
Tax History Compared to Growth
Tax History
| Year | Tax Paid | Tax Assessment Tax Assessment Total Assessment is a certain percentage of the fair market value that is determined by local assessors to be the total taxable value of land and additions on the property. | Land | Improvement |
|---|---|---|---|---|
| 2025 | $3,999 | $339,512 | $261,493 | $78,019 |
| 2024 | $3,999 | $332,855 | $256,365 | $76,490 |
| 2023 | $3,898 | $326,329 | $251,338 | $74,991 |
| 2022 | $3,846 | $319,931 | $246,410 | $73,521 |
| 2021 | $3,790 | $313,658 | $241,578 | $72,080 |
| 2020 | $3,767 | $310,442 | $239,101 | $71,341 |
| 2019 | $3,674 | $304,355 | $234,412 | $69,943 |
| 2018 | $3,607 | $298,388 | $229,816 | $68,572 |
| 2017 | $3,495 | $292,538 | $225,310 | $67,228 |
| 2016 | $3,428 | $286,802 | $220,892 | $65,910 |
| 2015 | $3,389 | $282,494 | $217,574 | $64,920 |
| 2014 | $3,220 | $276,961 | $213,312 | $63,649 |
Source: Public Records
Map
Nearby Homes
- 6681 Via Arroyo Dr
- 6528 University Way
- 9009 Harvard Ave
- 6344 Orange Ave
- 17 Citrus Glen
- 6166 Orange Ave
- 9704 Doreen Dr
- 6507 San Alano Cir
- 9694 Mount Barnard Dr
- 6741 W Lincoln Ave Unit 32
- 6741 Lincoln Ave Unit 108
- 6741 Lincoln Ave Unit 155
- 9792 Juanita St
- 3402 W Danbrook Ave
- 6036 Jeffrey Mark St
- 9592 Sonwell Place
- 6893 San Bruno Dr
- 6034 Fred Dr
- 5781 Lime Ave
- 3333 W Keys Ln
- 9241 Via Balboa Cir
- 9263 Via Balboa Cir
- 9231 Via Balboa Cir
- 6541 Via Arroyo Dr
- 9242 Via Balboa Cir
- 9291 Via Balboa Cir
- 6553 Via Arroyo Dr
- 9230 Via Balboa Cir
- 9221 Via Balboa Cir
- 6542 Via Arroyo Dr
- 9303 Via Balboa Cir
- 9211 Via Balboa Cir
- 6565 Via Arroyo Dr
- 9220 Via Balboa Cir
- 9201 Via Balboa Cir
- 6554 Via Arroyo Dr
- 9315 Via Balboa Cir
- 6577 Via Arroyo Dr
- 6566 Via Arroyo Dr