Estimated Value: $249,000 - $423,497
3
Beds
2
Baths
1,920
Sq Ft
$162/Sq Ft
Est. Value
About This Home
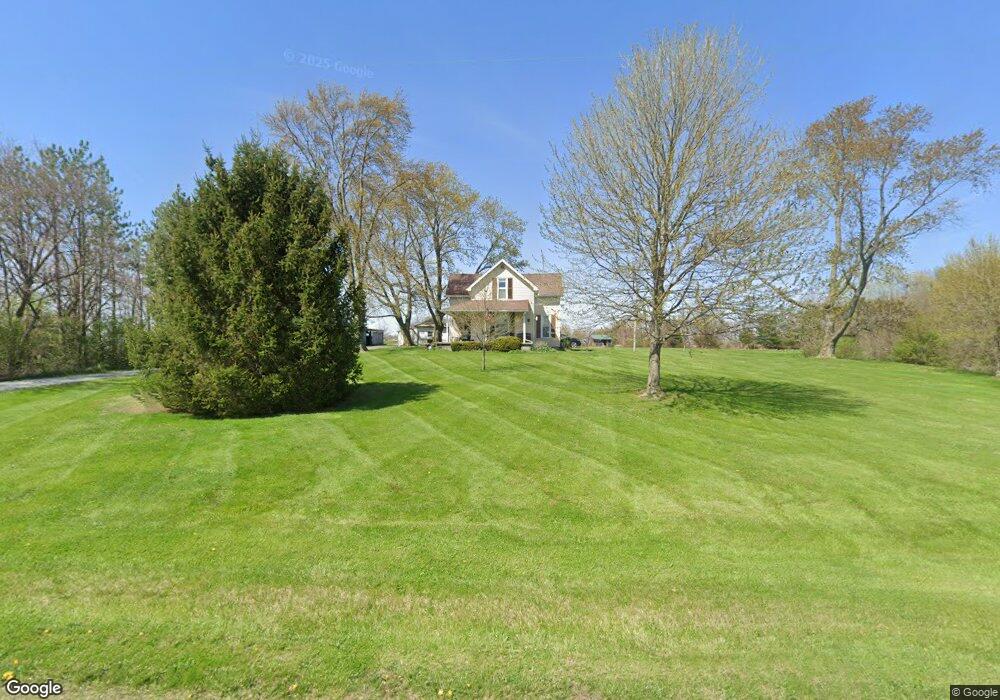
This home is located at 9252 E 1000 S, Amboy, IN 46911 and is currently estimated at $310,832, approximately $161 per square foot. 9252 E 1000 S is a home located in Miami County with nearby schools including Converse Elementary School, Sweetser Elementary School, and Oak Hill Junior High School.
Ownership History
Date
Name
Owned For
Owner Type
Purchase Details
Closed on
Apr 5, 2014
Sold by
Lawson Gloria Joan
Bought by
Bricker James W
Current Estimated Value
Home Financials for this Owner
Home Financials are based on the most recent Mortgage that was taken out on this home.
Original Mortgage
$557,680
Interest Rate
4.31%
Mortgage Type
Future Advance Clause Open End Mortgage
Purchase Details
Closed on
Sep 22, 2008
Sold by
Davis Susan M and Bricker James W
Bought by
Bricker Wanda L
Create a Home Valuation Report for This Property
The Home Valuation Report is an in-depth analysis detailing your home's value as well as a comparison with similar homes in the area
Purchase History
| Date | Buyer | Sale Price | Title Company |
|---|---|---|---|
| Bricker James W | -- | None Available | |
| Bricker Wanda L | -- | None Available | |
| Bricker James W | -- | None Available |
Source: Public Records
Mortgage History
| Date | Status | Borrower | Loan Amount |
|---|---|---|---|
| Previous Owner | Bricker James W | $557,680 |
Source: Public Records
Tax History
| Year | Tax Paid | Tax Assessment Tax Assessment Total Assessment is a certain percentage of the fair market value that is determined by local assessors to be the total taxable value of land and additions on the property. | Land | Improvement |
|---|---|---|---|---|
| 2025 | $4,153 | $326,200 | $176,800 | $149,400 |
| 2024 | $4,153 | $296,900 | $168,400 | $128,500 |
| 2023 | $4,153 | $274,300 | $143,700 | $130,600 |
| 2022 | $4,203 | $230,300 | $117,800 | $112,500 |
| 2021 | $3,777 | $207,200 | $104,100 | $103,100 |
| 2020 | $3,694 | $206,900 | $103,500 | $103,400 |
| 2019 | $4,002 | $225,500 | $121,700 | $103,800 |
| 2018 | $3,890 | $222,300 | $125,000 | $97,300 |
| 2017 | $3,796 | $233,600 | $136,900 | $96,700 |
| 2016 | $4,069 | $247,900 | $150,800 | $97,100 |
| 2014 | $4,050 | $253,400 | $157,000 | $96,400 |
| 2013 | -- | $231,800 | $137,100 | $94,700 |
Source: Public Records
Map
Nearby Homes
Your Personal Tour Guide
Ask me questions while you tour the home.