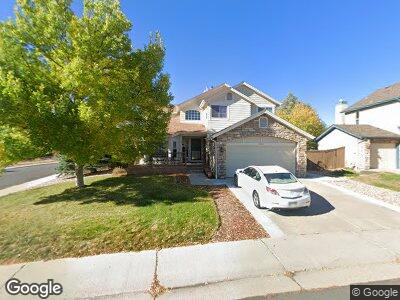
9253 Sugarstone Cir Highlands Ranch, CO 80130
Eastridge NeighborhoodEstimated Value: $688,653 - $766,000
4
Beds
4
Baths
2,026
Sq Ft
$355/Sq Ft
Est. Value
About This Home
This home is located at 9253 Sugarstone Cir, Highlands Ranch, CO 80130 and is currently estimated at $718,413, approximately $354 per square foot. 9253 Sugarstone Cir is a home located in Douglas County with nearby schools including Fox Creek Elementary School, Cresthill Middle School, and Highlands Ranch High School.
Ownership History
Date
Name
Owned For
Owner Type
Purchase Details
Closed on
Sep 14, 1999
Sold by
Umphryes Trust Helen M Umphryes Trustee For H
Bought by
Leeper Scott P and Leeper Stephanie F
Current Estimated Value
Home Financials for this Owner
Home Financials are based on the most recent Mortgage that was taken out on this home.
Original Mortgage
$175,920
Interest Rate
7.9%
Purchase Details
Closed on
Aug 2, 1996
Sold by
Umphryes Ephraim E and Umphryes Helen M
Bought by
Umphryes Helen M
Purchase Details
Closed on
Jun 29, 1995
Sold by
Chandar Ravi R and Chandar Aruna R
Bought by
Umphryes Ephraim E and Umphryes Helen M
Purchase Details
Closed on
Dec 31, 1992
Sold by
Ryland Group Inc
Bought by
Chandar Ravi R and Chandar Aruna R
Purchase Details
Closed on
Sep 21, 1992
Sold by
Mission Viejo Co
Bought by
Ryland Group Inc
Create a Home Valuation Report for This Property
The Home Valuation Report is an in-depth analysis detailing your home's value as well as a comparison with similar homes in the area
Home Values in the Area
Average Home Value in this Area
Purchase History
| Date | Buyer | Sale Price | Title Company |
|---|---|---|---|
| Leeper Scott P | $219,900 | Stewart Title | |
| Umphryes Helen M | -- | -- | |
| Umphryes Ephraim E | $183,400 | Title America | |
| Chandar Ravi R | $156,600 | -- | |
| Ryland Group Inc | $111,000 | -- |
Source: Public Records
Mortgage History
| Date | Status | Borrower | Loan Amount |
|---|---|---|---|
| Open | Leeper Scott P | $150,000 | |
| Closed | Leeper Scott | $155,000 | |
| Closed | Leeper Scott P | $193,500 | |
| Closed | Leeper Scott P | $186,000 | |
| Closed | Leeper Scott P | $179,000 | |
| Closed | Leeper Scott P | $175,920 |
Source: Public Records
Tax History Compared to Growth
Tax History
| Year | Tax Paid | Tax Assessment Tax Assessment Total Assessment is a certain percentage of the fair market value that is determined by local assessors to be the total taxable value of land and additions on the property. | Land | Improvement |
|---|---|---|---|---|
| 2024 | $3,982 | $45,930 | $11,420 | $34,510 |
| 2023 | $3,975 | $45,930 | $11,420 | $34,510 |
| 2022 | $3,294 | $36,050 | $7,750 | $28,300 |
| 2021 | $3,426 | $36,050 | $7,750 | $28,300 |
| 2020 | $3,067 | $33,070 | $8,220 | $24,850 |
| 2019 | $3,078 | $33,070 | $8,220 | $24,850 |
| 2018 | $2,753 | $29,130 | $7,160 | $21,970 |
| 2017 | $2,507 | $29,130 | $7,160 | $21,970 |
| 2016 | $2,424 | $27,650 | $7,170 | $20,480 |
| 2015 | $2,476 | $27,650 | $7,170 | $20,480 |
| 2014 | $2,082 | $21,460 | $6,130 | $15,330 |
Source: Public Records
Map
Nearby Homes
- 23 Shetland Ct
- 31 Shetland Ct
- 9229 Sugarstone Cir
- 9182 Weeping Willow Ct
- 9161 Weeping Willow Ct
- 9145 Sugarstone Cir
- 11 Canongate Ln
- 5322 Shetland Ct
- 9265 Buttonhill Ct
- 5204 Shetland Ct
- 6340 Ashburn Ln
- 6307 Monterey Place
- 8922 Tuscany Ln
- 33 Canongate Ln
- 5075 Weeping Willow Cir
- 6434 Laguna Cir
- 9431 Crossland Way
- 6436 Silver Mesa Dr Unit E
- 6424 Silver Mesa Dr Unit C
- 9471 Crossland Way
- 9253 Sugarstone Cir
- 9251 Sugarstone Cir
- 9117 Sugarstone Cir
- 9249 Sugarstone Cir
- 9252 Sugarstone Cir
- 9250 Sugarstone Cir
- 9116 Sugarstone Cir
- 9119 Sugarstone Cir
- 9248 Sugarstone Cir
- 9247 Sugarstone Cir
- 9211 Madras Ct
- 9118 Sugarstone Cir
- 9246 Sugarstone Cir
- 9121 Sugarstone Cir
- 9217 Madras Ct
- 9245 Sugarstone Cir
- 9205 Madras Ct
- 9210 Buttonhill Ct
- 9123 Sugarstone Cir
- 9102 Weeping Willow Ct