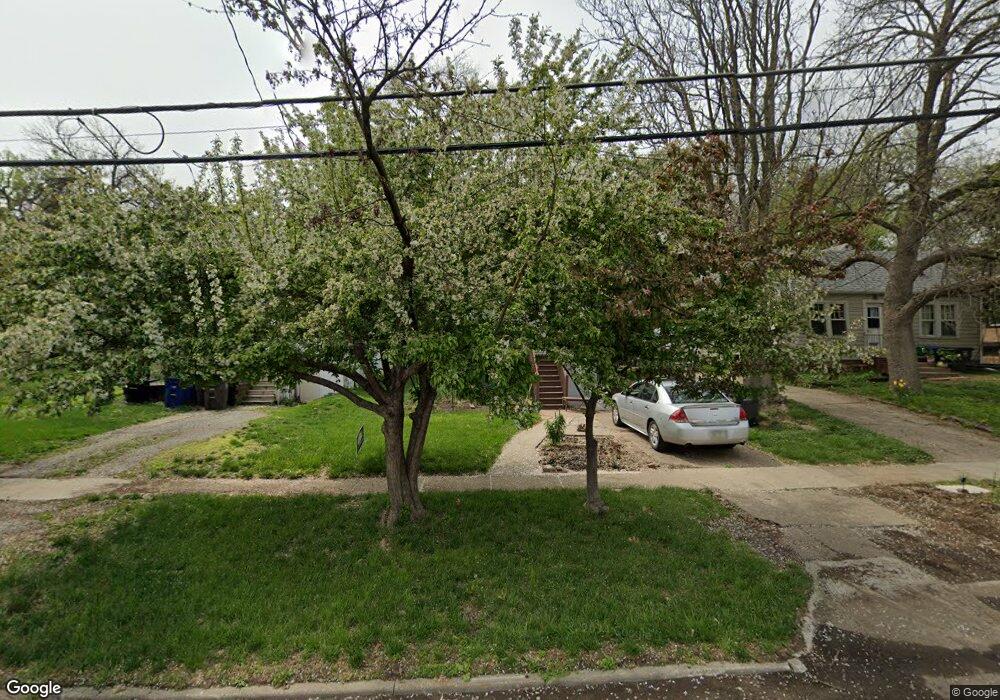
926 28th St Des Moines, IA 50312
Drake NeighborhoodEstimated Value: $129,000 - $173,000
3
Beds
1
Bath
886
Sq Ft
$166/Sq Ft
Est. Value
About This Home
This home is located at 926 28th St, Des Moines, IA 50312 and is currently estimated at $146,732, approximately $165 per square foot. 926 28th St is a home located in Polk County with nearby schools including Hubbell Elementary and Roosevelt High School.
Ownership History
Date
Name
Owned For
Owner Type
Purchase Details
Closed on
Dec 12, 2006
Sold by
Vaughn Robinson Craig W Mohler and Mohler Craig W
Bought by
Daniels Preston A and Daniels Patricia A
Current Estimated Value
Home Financials for this Owner
Home Financials are based on the most recent Mortgage that was taken out on this home.
Original Mortgage
$61,200
Interest Rate
6.24%
Mortgage Type
Purchase Money Mortgage
Purchase Details
Closed on
Aug 21, 2002
Sold by
Buikema Randal A
Bought by
Mohler Craig W
Purchase Details
Closed on
Sep 1, 2000
Sold by
Marasco Michael A and Marasco Kathryn K
Bought by
Weis Donna L
Home Financials for this Owner
Home Financials are based on the most recent Mortgage that was taken out on this home.
Original Mortgage
$32,910
Interest Rate
10%
Mortgage Type
Seller Take Back
Create a Home Valuation Report for This Property
The Home Valuation Report is an in-depth analysis detailing your home's value as well as a comparison with similar homes in the area
Home Values in the Area
Average Home Value in this Area
Purchase History
| Date | Buyer | Sale Price | Title Company |
|---|---|---|---|
| Daniels Preston A | $66,000 | None Available | |
| Mohler Craig W | -- | -- | |
| Weis Donna L | $34,501 | -- |
Source: Public Records
Mortgage History
| Date | Status | Borrower | Loan Amount |
|---|---|---|---|
| Closed | Daniels Preston A | $61,200 | |
| Previous Owner | Weis Donna L | $32,910 |
Source: Public Records
Tax History Compared to Growth
Tax History
| Year | Tax Paid | Tax Assessment Tax Assessment Total Assessment is a certain percentage of the fair market value that is determined by local assessors to be the total taxable value of land and additions on the property. | Land | Improvement |
|---|---|---|---|---|
| 2025 | $2,084 | $122,700 | $35,100 | $87,600 |
| 2024 | $2,084 | $105,900 | $30,300 | $75,600 |
| 2023 | $1,954 | $105,900 | $30,300 | $75,600 |
| 2022 | $1,938 | $82,900 | $24,400 | $58,500 |
| 2021 | $1,822 | $82,900 | $24,400 | $58,500 |
| 2020 | $1,892 | $73,000 | $21,600 | $51,400 |
| 2019 | $1,768 | $73,000 | $21,600 | $51,400 |
| 2018 | $1,750 | $65,800 | $14,900 | $50,900 |
| 2017 | $1,628 | $65,800 | $14,900 | $50,900 |
| 2016 | $1,760 | $60,200 | $13,500 | $46,700 |
| 2015 | $1,546 | $58,700 | $13,500 | $45,200 |
| 2014 | $1,516 | $59,200 | $13,600 | $45,600 |
Source: Public Records
Map
Nearby Homes