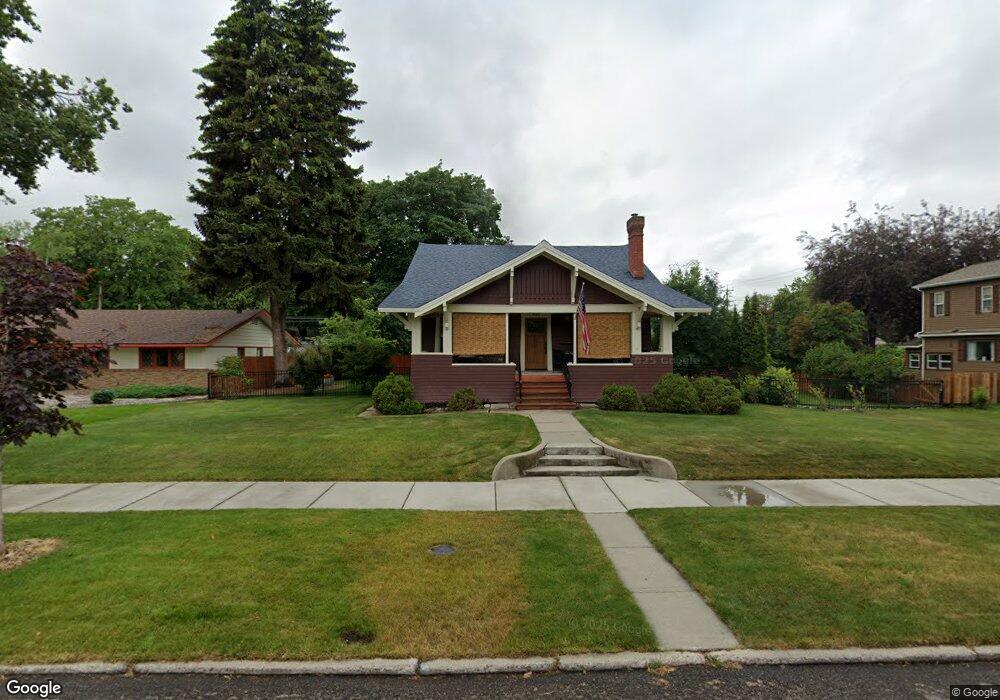
926 2nd Ave E Kalispell, MT 59901
Estimated Value: $516,000 - $695,152
4
Beds
3
Baths
1,776
Sq Ft
$335/Sq Ft
Est. Value
About This Home
This home is located at 926 2nd Ave E, Kalispell, MT 59901 and is currently estimated at $594,288, approximately $334 per square foot. 926 2nd Ave E is a home located in Flathead County with nearby schools including Cornelius Hedges School, Kalispell Middle School, and Flathead High School.
Ownership History
Date
Name
Owned For
Owner Type
Purchase Details
Closed on
May 7, 2015
Sold by
Simon Thomas Jenny and Nelson Leif
Bought by
Hagel Scott and Hagel Jean
Current Estimated Value
Home Financials for this Owner
Home Financials are based on the most recent Mortgage that was taken out on this home.
Original Mortgage
$362,041
Outstanding Balance
$278,498
Interest Rate
3.64%
Mortgage Type
New Conventional
Estimated Equity
$315,790
Purchase Details
Closed on
Dec 11, 2013
Sold by
Nelson Leif A and Simon Thomas Jennifer A
Bought by
Jast Holdings Llc
Purchase Details
Closed on
Dec 16, 2009
Sold by
Simon Thomas Jenny
Bought by
Simon Thomas Jenny and Nelson Leif
Home Financials for this Owner
Home Financials are based on the most recent Mortgage that was taken out on this home.
Original Mortgage
$259,000
Interest Rate
4.91%
Mortgage Type
New Conventional
Create a Home Valuation Report for This Property
The Home Valuation Report is an in-depth analysis detailing your home's value as well as a comparison with similar homes in the area
Purchase History
| Date | Buyer | Sale Price | Title Company |
|---|---|---|---|
| Hagel Scott | -- | Insured Titles | |
| Jast Holdings Llc | -- | First Title Of Montana | |
| Simon Thomas Jenny | -- | Insured Titles | |
| Simon Thomas Jenny | -- | Insured Titles |
Source: Public Records
Mortgage History
| Date | Status | Borrower | Loan Amount |
|---|---|---|---|
| Open | Hagel Scott | $362,041 | |
| Previous Owner | Simon Thomas Jenny | $259,000 |
Source: Public Records
Tax History
| Year | Tax Paid | Tax Assessment Tax Assessment Total Assessment is a certain percentage of the fair market value that is determined by local assessors to be the total taxable value of land and additions on the property. | Land | Improvement |
|---|---|---|---|---|
| 2025 | $4,065 | $706,100 | $0 | $0 |
| 2024 | $4,374 | $561,700 | $0 | $0 |
| 2023 | $5,032 | $561,700 | $0 | $0 |
| 2022 | $5,620 | $450,000 | $0 | $0 |
| 2021 | $4,843 | $450,000 | $0 | $0 |
| 2020 | $5,031 | $370,600 | $0 | $0 |
| 2019 | $5,056 | $370,600 | $0 | $0 |
| 2018 | $5,154 | $363,400 | $0 | $0 |
| 2017 | $5,183 | $363,400 | $0 | $0 |
| 2016 | $3,287 | $221,300 | $0 | $0 |
| 2015 | $3,334 | $221,300 | $0 | $0 |
| 2014 | $3,113 | $145,803 | $0 | $0 |
Source: Public Records
Map
Nearby Homes
- 1312 2nd Ave E
- 519 1st Ave E
- 209 12th St W
- 723 5th Ave E Unit 318-S
- 484 1st Ave E
- 1305 4th Ave E
- 635 3rd Ave W
- 442 4th Ave E
- NHN 11th St W
- 442 2nd Ave W
- 715 8th St E
- 826 11th St E
- 236 3rd Ave W Unit 2S
- 3953 US Highway 93 S
- 1313 7th Ave W
- 1230 7th Ave W
- Nhn 11th St W
- 1308 7th Ave W
- 31 5th Ave E
- 51 Selders Ln
Your Personal Tour Guide
Ask me questions while you tour the home.