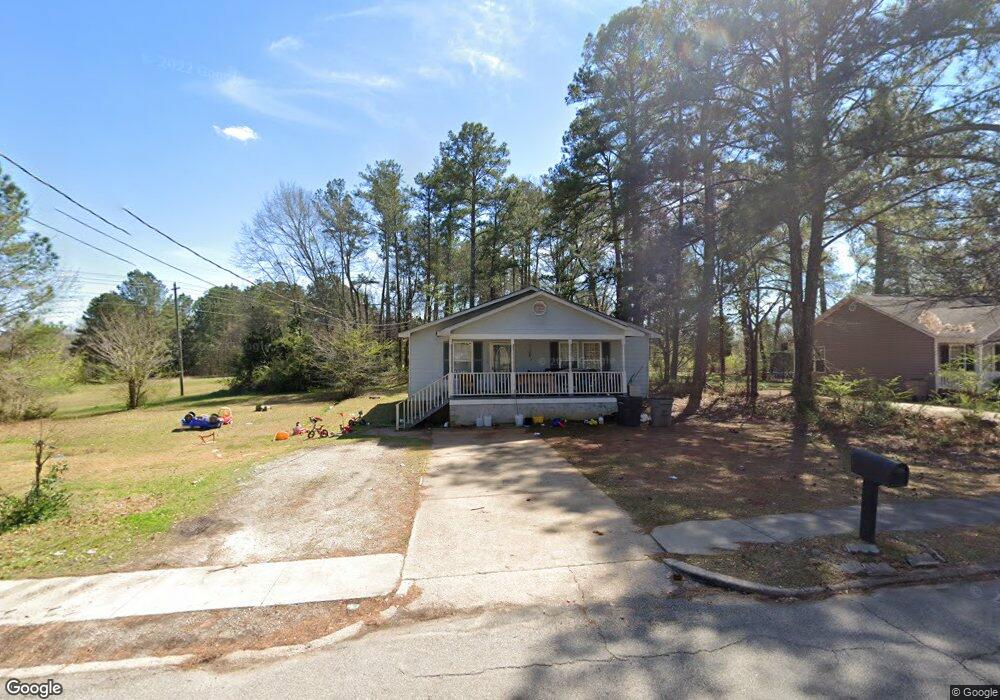
926 Borton St Lagrange, GA 30241
Estimated Value: $69,000 - $181,000
3
Beds
2
Baths
1,280
Sq Ft
$94/Sq Ft
Est. Value
About This Home
This home is located at 926 Borton St, Lagrange, GA 30241 and is currently estimated at $120,666, approximately $94 per square foot. 926 Borton St is a home located in Troup County with nearby schools including Hollis Hand Elementary School, Franklin Forest Elementary School, and Ethel W. Kight Elementary School.
Ownership History
Date
Name
Owned For
Owner Type
Purchase Details
Closed on
Jul 6, 2016
Bought by
Rc Capital Investments Llc
Current Estimated Value
Purchase Details
Closed on
Apr 5, 2016
Sold by
Spence Pamela
Bought by
Wells Fargo Bank
Purchase Details
Closed on
May 5, 2004
Sold by
Secretary Of Hud
Bought by
Spence Pamela
Purchase Details
Closed on
Sep 3, 2003
Sold by
Reginia Collier
Bought by
Secretary Of Hud
Purchase Details
Closed on
Sep 2, 2003
Sold by
Wells Fargo Mortga
Bought by
Reginia Collier
Purchase Details
Closed on
Mar 6, 2002
Sold by
Davis E C
Bought by
Wells Fargo Mortga
Purchase Details
Closed on
Oct 19, 2001
Sold by
Cato J
Bought by
Davis E C
Purchase Details
Closed on
Aug 20, 1993
Sold by
Ethel Cato
Bought by
Cato J
Purchase Details
Closed on
Jan 1, 1972
Sold by
Eldora Fish Cato
Bought by
Ethel Cato
Purchase Details
Closed on
Jan 1, 1948
Bought by
Eldora Fish Cato
Create a Home Valuation Report for This Property
The Home Valuation Report is an in-depth analysis detailing your home's value as well as a comparison with similar homes in the area
Purchase History
| Date | Buyer | Sale Price | Title Company |
|---|---|---|---|
| Rc Capital Investments Llc | $29,000 | -- | |
| Wells Fargo Bank | $37,400 | -- | |
| Spence Pamela | $64,000 | -- | |
| Secretary Of Hud | $85,800 | -- | |
| Reginia Collier | $85,800 | -- | |
| Wells Fargo Mortga | $83,500 | -- | |
| Davis E C | $7,500 | -- | |
| Cato J | -- | -- | |
| Ethel Cato | -- | -- | |
| Eldora Fish Cato | -- | -- |
Source: Public Records
Tax History
| Year | Tax Paid | Tax Assessment Tax Assessment Total Assessment is a certain percentage of the fair market value that is determined by local assessors to be the total taxable value of land and additions on the property. | Land | Improvement |
|---|---|---|---|---|
| 2025 | $1,139 | $41,760 | $3,720 | $38,040 |
| 2024 | $1,067 | $39,120 | $3,720 | $35,400 |
| 2023 | $859 | $31,480 | $3,720 | $27,760 |
| 2022 | $835 | $29,920 | $3,720 | $26,200 |
| 2021 | $686 | $22,760 | $2,800 | $19,960 |
| 2020 | $686 | $22,760 | $2,800 | $19,960 |
| 2019 | $645 | $21,400 | $2,800 | $18,600 |
| 2018 | $645 | $21,400 | $2,800 | $18,600 |
| 2017 | $339 | $24,240 | $2,800 | $21,440 |
| 2016 | $683 | $24,634 | $2,804 | $21,830 |
| 2015 | $685 | $24,634 | $2,804 | $21,830 |
| 2014 | $651 | $23,485 | $2,804 | $20,681 |
| 2013 | -- | $28,236 | $2,804 | $25,432 |
Source: Public Records
Map
Nearby Homes
- 1017 Mason St
- 0 Kelley St Unit 10550311
- 957 Kelley St
- 626 Smoot St
- 510 Smoot St
- 203 Revis St
- 205 Revis St
- 0 Brown St Unit 10550761
- 0 Brown St Unit 10550754
- 0 Burr St
- 306 Burr St
- 459 Merrywood Dr
- 117 Belk St
- LOT 58 Belk St
- 119 Belk St
- LOT 65 Belk St
- LOT 66 Belk St
- 200 Mccall St
- 0 Locust St
- 105 Dix St
Your Personal Tour Guide
Ask me questions while you tour the home.