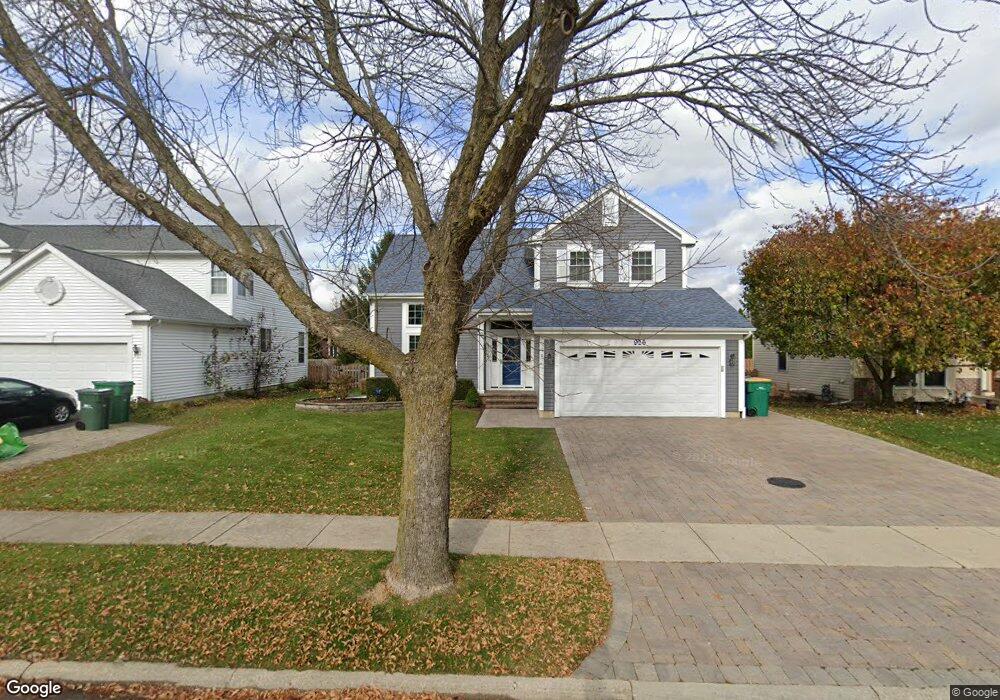
926 Braymore Dr Grayslake, IL 60030
Estimated Value: $441,000 - $464,000
3
Beds
3
Baths
2,198
Sq Ft
$205/Sq Ft
Est. Value
About This Home
This home is located at 926 Braymore Dr, Grayslake, IL 60030 and is currently estimated at $450,988, approximately $205 per square foot. 926 Braymore Dr is a home located in Lake County with nearby schools including Woodland Primary School, Woodland Elementary School, and Woodland Intermediate School.
Ownership History
Date
Name
Owned For
Owner Type
Purchase Details
Closed on
Oct 7, 2015
Sold by
Campbell Shari L and Stang Shari L
Bought by
Stang Eugene C and Stang Shari L
Current Estimated Value
Purchase Details
Closed on
May 30, 2002
Sold by
Gillen Henry J and Gillen Nancy A
Bought by
Campbell Shari L
Home Financials for this Owner
Home Financials are based on the most recent Mortgage that was taken out on this home.
Original Mortgage
$241,300
Interest Rate
6.7%
Purchase Details
Closed on
May 23, 1997
Sold by
Buddle Charles Roy and Buddle Isabel Maria
Bought by
Gillen Henry J and Gillen Nancy A
Home Financials for this Owner
Home Financials are based on the most recent Mortgage that was taken out on this home.
Original Mortgage
$181,500
Interest Rate
7.57%
Purchase Details
Closed on
Sep 3, 1994
Sold by
Buddle Charles Roy
Bought by
Buddle Charles Roy and Buddle Isabel Maria
Purchase Details
Closed on
Aug 4, 1994
Sold by
Northern Trust Bk Lake Forest Natl Assn
Bought by
Buddle Charles Roy
Create a Home Valuation Report for This Property
The Home Valuation Report is an in-depth analysis detailing your home's value as well as a comparison with similar homes in the area
Home Values in the Area
Average Home Value in this Area
Purchase History
| Date | Buyer | Sale Price | Title Company |
|---|---|---|---|
| Stang Eugene C | -- | None Available | |
| Campbell Shari L | $254,000 | -- | |
| Gillen Henry J | $127,666 | Attorneys Natl Title Network | |
| Buddle Charles Roy | -- | -- | |
| Buddle Charles Roy | $189,000 | Ticor Title Insurance Compan |
Source: Public Records
Mortgage History
| Date | Status | Borrower | Loan Amount |
|---|---|---|---|
| Previous Owner | Campbell Shari L | $241,300 | |
| Previous Owner | Gillen Henry J | $181,500 |
Source: Public Records
Tax History Compared to Growth
Tax History
| Year | Tax Paid | Tax Assessment Tax Assessment Total Assessment is a certain percentage of the fair market value that is determined by local assessors to be the total taxable value of land and additions on the property. | Land | Improvement |
|---|---|---|---|---|
| 2024 | $11,023 | $115,787 | $22,809 | $92,978 |
| 2023 | $9,599 | $106,265 | $20,933 | $85,332 |
| 2022 | $9,599 | $91,260 | $13,051 | $78,209 |
| 2021 | $9,452 | $87,716 | $12,544 | $75,172 |
| 2020 | $10,528 | $92,731 | $11,935 | $80,796 |
| 2019 | $10,138 | $88,968 | $11,451 | $77,517 |
| 2018 | $9,886 | $87,877 | $13,907 | $73,970 |
| 2017 | $9,862 | $82,662 | $13,082 | $69,580 |
| 2016 | $9,387 | $76,306 | $12,076 | $64,230 |
| 2015 | $9,009 | $69,711 | $11,032 | $58,679 |
| 2014 | $8,536 | $65,042 | $10,377 | $54,665 |
| 2012 | $8,491 | $67,929 | $10,838 | $57,091 |
Source: Public Records
Map
Nearby Homes
- 355 Buckingham Dr
- 399 Banbury Ln
- 707 Crossland Dr
- 23 Bobolink Dr
- 633 Dove Ct Unit 4
- 745 Dillon Ct
- 820 Amelia Ct
- 1191 Hummingbird Ln
- 873 Essex Cir
- 618 Barron Blvd
- 418 Flanders Ln
- 1045 Manchester Cir
- 146 Westerfield Place
- 20295 W Washington St
- 1617 Albany St
- 268 Normandy Ln
- 33276 N Sunset Ave
- 121 Park Ave
- 390 N Garfield Blvd
- 33336 N Indian Ln
- 934 Braymore Dr Unit 2
- 914 Braymore Dr
- 946 Braymore Dr
- 310 Dorchester Ln
- 306 Dorchester Ln
- 314 Dorchester Ln
- 901 Cambridge Dr
- 302 Dorchester Ln
- 958 Braymore Dr
- 318 Dorchester Ln
- 903 Cambridge Dr
- 298 Dorchester Ln
- 951 Braymore Dr
- 972 Braymore Dr
- 907 Cambridge Dr
- 322 Dorchester Ln
- 321 Dorchester Ln
- 959 Braymore Dr
- 302 Buckingham Dr
- 916 Dunhill Rd