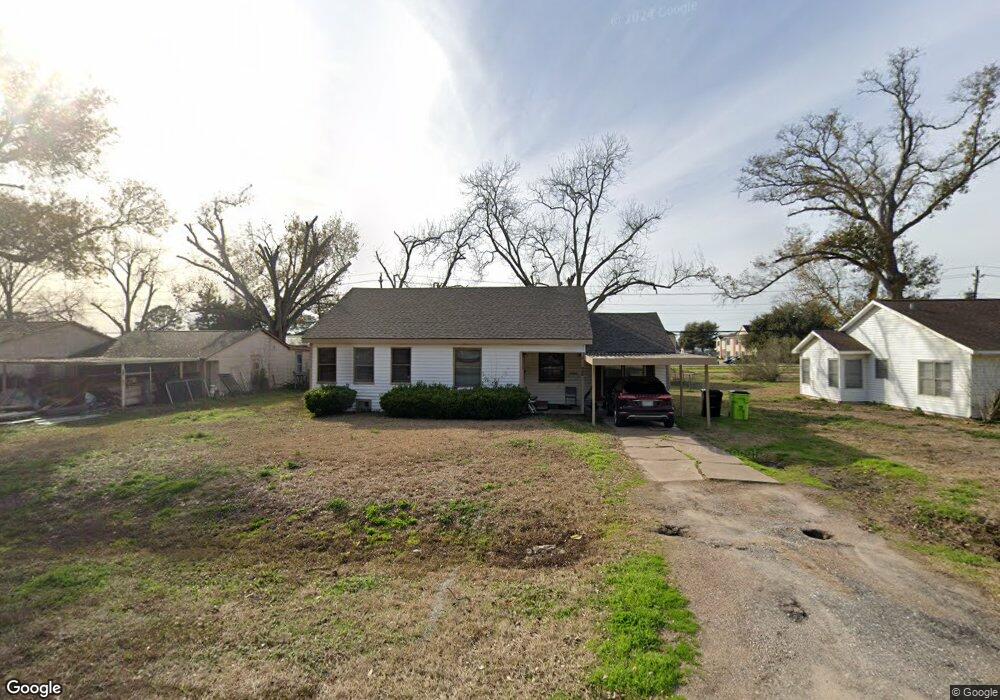
926 Horace Mann Ave Rosenberg, TX 77471
Estimated Value: $222,000 - $294,000
3
Beds
2
Baths
1,542
Sq Ft
$164/Sq Ft
Est. Value
About This Home
This home is located at 926 Horace Mann Ave, Rosenberg, TX 77471 and is currently estimated at $252,469, approximately $163 per square foot. 926 Horace Mann Ave is a home located in Fort Bend County with nearby schools including Smith Elementary School, J J Wessendorff Middle School, and Lamar Junior High School.
Ownership History
Date
Name
Owned For
Owner Type
Purchase Details
Closed on
Nov 12, 2021
Sold by
Walzel Corey Ross and Estate Of Deanna R Walzel
Bought by
Harkor Homes Llc
Current Estimated Value
Purchase Details
Closed on
Jul 1, 2013
Sold by
Shuttlesworth Kelvin K
Bought by
Holt Cal
Purchase Details
Closed on
Nov 10, 2008
Sold by
Orellana Hugo A
Bought by
Pleitez Delmy
Purchase Details
Closed on
Oct 1, 2002
Sold by
Villalobos David and Villalobos Maria D
Bought by
Homeside Lending Inc
Purchase Details
Closed on
Aug 5, 2002
Sold by
Zarate Ninfa
Bought by
Zarate Ninfa
Purchase Details
Closed on
Aug 31, 1999
Sold by
Bunker Alfred E
Bought by
Zarate Ruben C and Zarate Ninfa
Purchase Details
Closed on
Apr 28, 1998
Sold by
Villaloboz Mary Marie Hartman and Jordan Idella J
Bought by
Hartman Harry L
Purchase Details
Closed on
Sep 27, 1984
Sold by
Hermes Cleophus M
Bought by
Zarate Ninfa
Create a Home Valuation Report for This Property
The Home Valuation Report is an in-depth analysis detailing your home's value as well as a comparison with similar homes in the area
Home Values in the Area
Average Home Value in this Area
Purchase History
| Date | Buyer | Sale Price | Title Company |
|---|---|---|---|
| Harkor Homes Llc | -- | Interamerica Ttl Group Sugar | |
| Holt Cal | -- | Startex Title Company Llc | |
| Pleitez Delmy | -- | None Available | |
| Homeside Lending Inc | $72,714 | -- | |
| Zarate Ninfa | -- | -- | |
| Zarate Ruben C | -- | American Title Co | |
| Hartman Harry L | -- | Rosenberg Title Co | |
| Zarate Ninfa | -- | -- |
Source: Public Records
Tax History Compared to Growth
Tax History
| Year | Tax Paid | Tax Assessment Tax Assessment Total Assessment is a certain percentage of the fair market value that is determined by local assessors to be the total taxable value of land and additions on the property. | Land | Improvement |
|---|---|---|---|---|
| 2025 | $196 | $120,875 | $17,200 | $103,675 |
| 2024 | $196 | $149,883 | $17,200 | $132,683 |
| 2023 | $175 | $139,249 | $3,521 | $135,728 |
| 2022 | $99 | $126,590 | $3,560 | $123,030 |
| 2021 | $2,388 | $115,080 | $17,200 | $97,880 |
| 2020 | $2,332 | $109,880 | $17,200 | $92,680 |
| 2019 | $2,641 | $115,640 | $17,200 | $98,440 |
| 2018 | $2,558 | $110,210 | $17,200 | $93,010 |
| 2017 | $2,458 | $105,300 | $17,200 | $88,100 |
| 2016 | $2,461 | $105,420 | $17,200 | $88,220 |
| 2015 | $334 | $106,120 | $17,200 | $88,920 |
| 2014 | $330 | $102,290 | $17,200 | $85,090 |
Source: Public Records
Map
Nearby Homes
- 1504 Radio Ln
- 4707 E Parma Dr
- 3724 Avenue F
- 0 Miles St
- 4602 Avenue H
- 1009 Lawrence St
- 3710 Avenue F
- 1215 Lawrence St
- 1119 Tobola St
- 5121 Alderney Ct
- 1300 Lawrence St
- 5106 Alderney Ct
- 1317 Tobola St
- 1633 Jones St
- 1816 Spruce Dr
- 4605 Greenwood Dr
- 1803 Jones St
- 1711 Klauke St
- 3433 Avenue P
- 1403 Divin Dr
- 920 Horace Mann Ave
- 932 Horace Mann Ave
- 914 Horace Mann Ave
- 1002 Horace Mann Ave
- 1008 Horace Mann Ave
- 904 Horace Mann Ave
- 1014 Horace Mann Ave
- 1020 Horace Mann Ave
- 1011 Avenue E
- 1026 Horace Mann Ave
- 1032 Horace Mann Ave
- 4201 Avenue N
- 0 Avenue I Unit 56675037
- 0 Avenue I Unit 7683243
- 0 Avenue I Unit 5602237
- * Avenue I
- 4104 Avenue H
- 3908 Avenue I
- 4401 W Parma Dr
- 4403 W Parma Dr