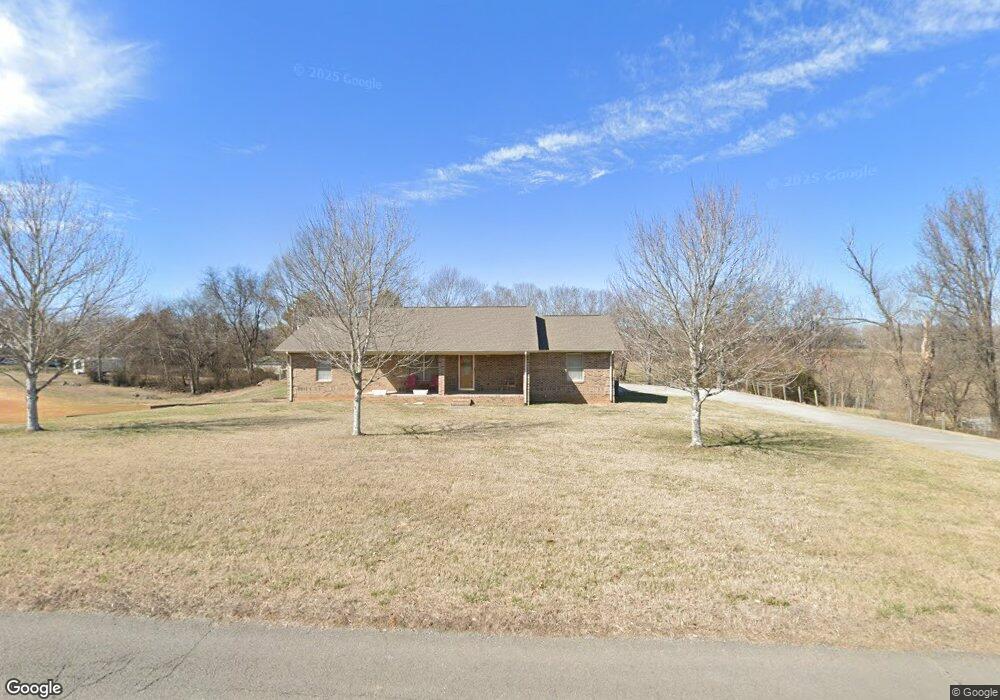
926 Ingram Rd Talbott, TN 37877
Estimated Value: $367,000 - $387,000
Studio
2
Baths
2,075
Sq Ft
$180/Sq Ft
Est. Value
About This Home
This home is located at 926 Ingram Rd, Talbott, TN 37877 and is currently estimated at $374,461, approximately $180 per square foot. 926 Ingram Rd is a home located in Jefferson County.
Ownership History
Date
Name
Owned For
Owner Type
Purchase Details
Closed on
Apr 21, 2023
Sold by
Livesay Patricia Anne
Bought by
Livesay Michael Craig
Current Estimated Value
Purchase Details
Closed on
Dec 30, 2022
Sold by
White April L
Bought by
White Robbie L and White April L
Purchase Details
Closed on
Mar 8, 2004
Bought by
White April Lucretia Jones
Home Financials for this Owner
Home Financials are based on the most recent Mortgage that was taken out on this home.
Original Mortgage
$100,000
Interest Rate
5.72%
Purchase Details
Closed on
Nov 12, 1999
Bought by
Jones John and Jones April
Create a Home Valuation Report for This Property
The Home Valuation Report is an in-depth analysis detailing your home's value as well as a comparison with similar homes in the area
Purchase History
| Date | Buyer | Sale Price | Title Company |
|---|---|---|---|
| Livesay Michael Craig | -- | None Listed On Document | |
| Livesay Michael Craig | -- | None Listed On Document | |
| White Robbie L | -- | -- | |
| White Robbie L | -- | None Listed On Document | |
| White April Lucretia Jones | -- | -- | |
| Jones John | $1,000 | -- |
Source: Public Records
Mortgage History
| Date | Status | Borrower | Loan Amount |
|---|---|---|---|
| Previous Owner | Jones John | $100,000 |
Source: Public Records
Tax History
| Year | Tax Paid | Tax Assessment Tax Assessment Total Assessment is a certain percentage of the fair market value that is determined by local assessors to be the total taxable value of land and additions on the property. | Land | Improvement |
|---|---|---|---|---|
| 2025 | $1,492 | $104,350 | $6,300 | $98,050 |
| 2023 | $1,287 | $55,975 | $0 | $0 |
| 2022 | $1,226 | $55,975 | $3,600 | $52,375 |
| 2021 | $1,226 | $55,975 | $3,600 | $52,375 |
| 2020 | $1,226 | $55,975 | $3,600 | $52,375 |
| 2019 | $1,226 | $55,975 | $3,600 | $52,375 |
| 2018 | $1,142 | $48,600 | $3,600 | $45,000 |
| 2017 | $1,142 | $48,600 | $3,600 | $45,000 |
| 2016 | $1,142 | $48,600 | $3,600 | $45,000 |
| 2015 | $1,142 | $48,600 | $3,600 | $45,000 |
| 2014 | $1,142 | $48,600 | $3,600 | $45,000 |
Source: Public Records
Map
Nearby Homes
- 1770 Mount Pleasant Rd
- 1991 Kaylee Dr
- 2718 Mayfield Dr
- 877 Greene Meadow Dr
- 881 Greene Meadow Dr
- 351 Caroline Ct
- 1112 Janice Ln
- 1116 Janice Ln
- 1015 Sherman Way
- 825 Greene Meadow Dr
- 825 Greene Meadow Dr Unit Green Meadow Dr
- 921 Erica Dr
- 2548 Lucille Ln
- 158 Claire Place
- 104 Claire Place
- 908 Erica Dr
- 914 Flax Ln
- 413 English Dr
- Lot 18 Kaylee Dr
- 1237 Cole Dr
Your Personal Tour Guide
Ask me questions while you tour the home.