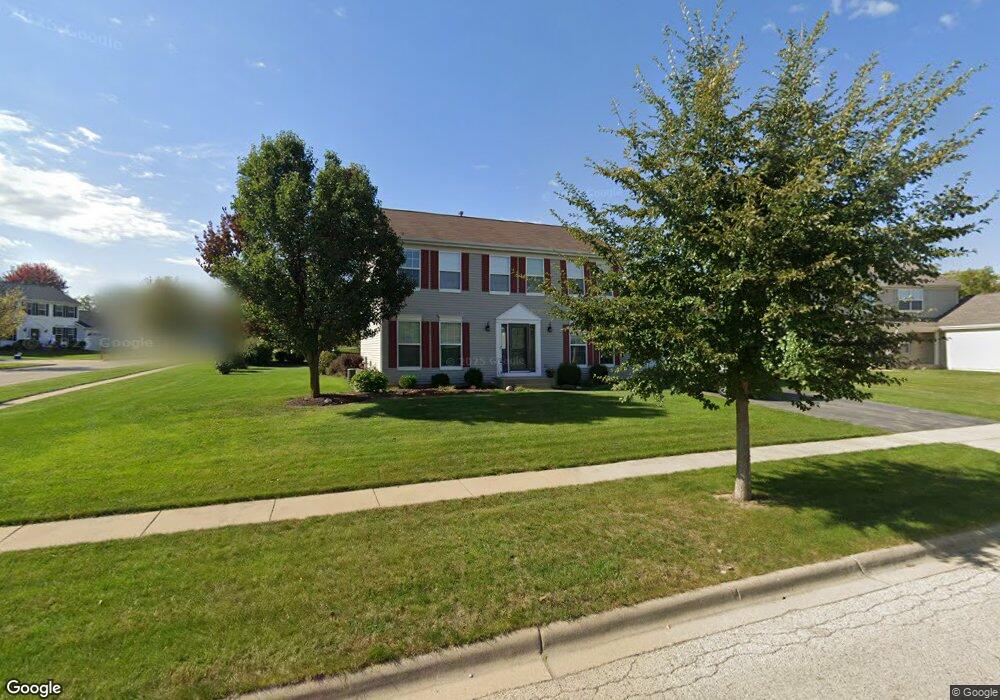
926 Limerick Ln McHenry, IL 60050
Estimated Value: $366,094 - $448,000
4
Beds
3
Baths
2,016
Sq Ft
$205/Sq Ft
Est. Value
About This Home
This home is located at 926 Limerick Ln, McHenry, IL 60050 and is currently estimated at $413,774, approximately $205 per square foot. 926 Limerick Ln is a home located in McHenry County with nearby schools including Valley View Elementary School, Parkland School, and Montini Catholic School.
Ownership History
Date
Name
Owned For
Owner Type
Purchase Details
Closed on
Jun 21, 2018
Sold by
Karras Matthew and Karras Susan
Bought by
Karras Matthew J and Karras Susan L
Current Estimated Value
Purchase Details
Closed on
Jun 21, 2006
Sold by
Knox Richard R and Knox Jo Ellen
Bought by
Karras Matthew and Karras Susan
Home Financials for this Owner
Home Financials are based on the most recent Mortgage that was taken out on this home.
Original Mortgage
$278,806
Outstanding Balance
$165,287
Interest Rate
6.72%
Mortgage Type
VA
Estimated Equity
$248,487
Purchase Details
Closed on
Nov 22, 2004
Sold by
Legend Lakes Lp
Bought by
Knox Richard R and Knox Jo Ellen
Home Financials for this Owner
Home Financials are based on the most recent Mortgage that was taken out on this home.
Original Mortgage
$221,357
Interest Rate
5.71%
Mortgage Type
Unknown
Create a Home Valuation Report for This Property
The Home Valuation Report is an in-depth analysis detailing your home's value as well as a comparison with similar homes in the area
Home Values in the Area
Average Home Value in this Area
Purchase History
| Date | Buyer | Sale Price | Title Company |
|---|---|---|---|
| Karras Matthew J | -- | Attorney | |
| Karras Matthew | $269,900 | Chicago Title Insurance Co | |
| Knox Richard R | $242,707 | Stewart Title Company |
Source: Public Records
Mortgage History
| Date | Status | Borrower | Loan Amount |
|---|---|---|---|
| Open | Karras Matthew | $278,806 | |
| Previous Owner | Knox Richard R | $221,357 |
Source: Public Records
Tax History
| Year | Tax Paid | Tax Assessment Tax Assessment Total Assessment is a certain percentage of the fair market value that is determined by local assessors to be the total taxable value of land and additions on the property. | Land | Improvement |
|---|---|---|---|---|
| 2024 | $8,453 | $107,929 | $24,306 | $83,623 |
| 2023 | $8,193 | $96,694 | $21,776 | $74,918 |
| 2022 | $8,258 | $92,930 | $23,426 | $69,504 |
| 2021 | $7,880 | $86,543 | $21,816 | $64,727 |
| 2020 | $7,619 | $82,936 | $20,907 | $62,029 |
| 2019 | $7,502 | $78,754 | $19,853 | $58,901 |
| 2018 | $7,928 | $75,183 | $18,953 | $56,230 |
| 2017 | $6,859 | $64,107 | $17,788 | $46,319 |
| 2016 | $6,630 | $59,913 | $16,624 | $43,289 |
| 2013 | -- | $56,999 | $16,368 | $40,631 |
Source: Public Records
Map
Nearby Homes
- 1001 Draper Rd
- 1028 Draper Rd
- 1029 Draper Rd
- 1053 Carrick Ln Unit 1053
- 507 Legend Ln
- 1420 Draper Rd
- 715 Legend Ln Unit 715
- 1358 Draper Rd Unit 254
- 6522 Sycamore Ct
- 1246 Draper Rd
- 1241 Draper Rd
- 6503 Tustamena Trail
- 6409 Donegal Ln
- 6708 Homestead Dr
- 5837 Fieldstone Trail Unit 5837
- 7111 Forest Oak Dr
- 6710 Killala Dr
- 7212 Forest Oak Dr
- 606 Waters Edge Dr Unit A
- 7319 Forest Oak Dr
- 922 Limerick Ln
- 6312 Shannon Dr
- 6303 Shannon Dr
- 923 Limerick Ln
- 918 Limerick Ln
- 6307 Shannon Dr
- 915 Limerick Ln
- 6315 Shannon Dr
- 6221 Shannon Dr
- 6311 Shannon Dr
- 914 Limerick Ln
- 6216 Shannon Dr
- 6217 Shannon Dr
- 903 Limerick Ln
- 910 Limerick Ln
- 6206 Longford Dr
- 6213 Shannon Dr
- 6208 Shannon Dr
- 6304 Midleton Ln
- 906 Limerick Ln
Your Personal Tour Guide
Ask me questions while you tour the home.