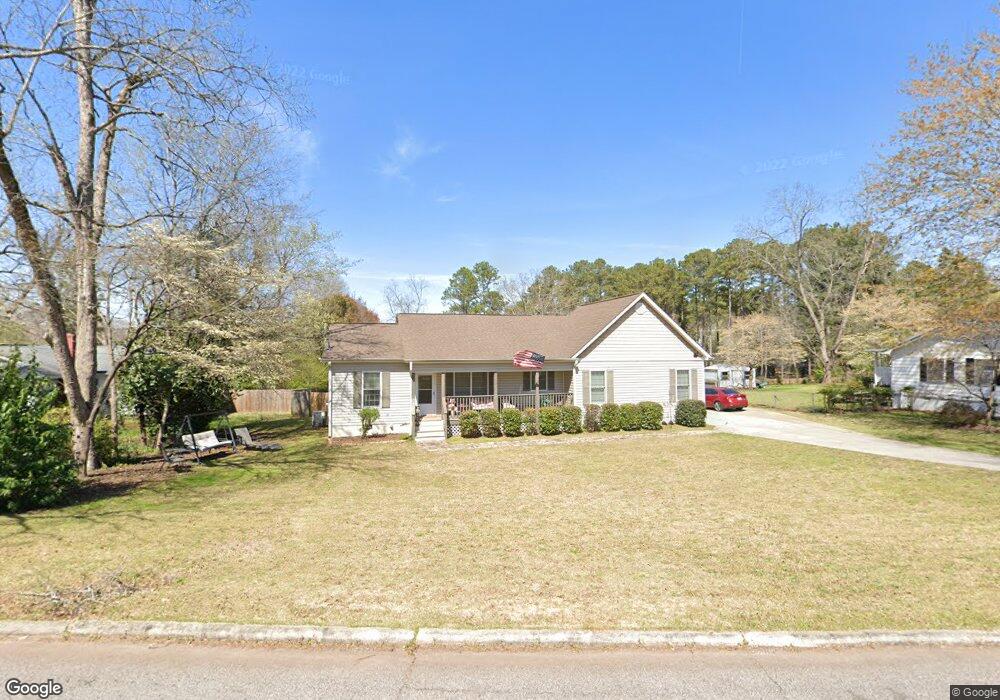
926 Malibu Dr Lagrange, GA 30240
Estimated Value: $178,000 - $255,000
3
Beds
2
Baths
1,482
Sq Ft
$148/Sq Ft
Est. Value
About This Home
This home is located at 926 Malibu Dr, Lagrange, GA 30240 and is currently estimated at $218,951, approximately $147 per square foot. 926 Malibu Dr is a home located in Troup County with nearby schools including Franklin Forest Elementary School, Hollis Hand Elementary School, and Ethel W. Kight Elementary School.
Ownership History
Date
Name
Owned For
Owner Type
Purchase Details
Closed on
Jun 27, 2019
Sold by
Smith Patrick Michael
Bought by
Dial Anita S
Current Estimated Value
Home Financials for this Owner
Home Financials are based on the most recent Mortgage that was taken out on this home.
Original Mortgage
$118,400
Outstanding Balance
$103,235
Interest Rate
3.9%
Mortgage Type
New Conventional
Estimated Equity
$115,716
Purchase Details
Closed on
Mar 11, 1986
Sold by
Smith Charles A and Smith Susan S
Bought by
Jabaley Richard P
Purchase Details
Closed on
Feb 7, 1985
Sold by
Smith Susan R Brock
Bought by
Smith Charles A and Smith Susan S
Purchase Details
Closed on
Aug 16, 1984
Sold by
Moore Charles L
Bought by
Smith Susan R Brock
Purchase Details
Closed on
Jan 17, 1975
Sold by
J Brumbeloe B and J E
Bought by
Moore Charles L
Create a Home Valuation Report for This Property
The Home Valuation Report is an in-depth analysis detailing your home's value as well as a comparison with similar homes in the area
Purchase History
| Date | Buyer | Sale Price | Title Company |
|---|---|---|---|
| Dial Anita S | $148,000 | -- | |
| Jabaley Richard P | $9,600 | -- | |
| Smith Charles A | -- | -- | |
| Smith Susan R Brock | $18,500 | -- | |
| Moore Charles L | $20,000 | -- |
Source: Public Records
Mortgage History
| Date | Status | Borrower | Loan Amount |
|---|---|---|---|
| Open | Dial Anita S | $118,400 |
Source: Public Records
Tax History
| Year | Tax Paid | Tax Assessment Tax Assessment Total Assessment is a certain percentage of the fair market value that is determined by local assessors to be the total taxable value of land and additions on the property. | Land | Improvement |
|---|---|---|---|---|
| 2025 | $1,536 | $84,240 | $6,000 | $78,240 |
| 2024 | $1,486 | $81,400 | $6,000 | $75,400 |
| 2023 | $1,117 | $67,840 | $6,000 | $61,840 |
| 2022 | $1,801 | $64,520 | $6,000 | $58,520 |
| 2021 | $1,940 | $64,320 | $6,000 | $58,320 |
| 2020 | $1,785 | $64,320 | $6,000 | $58,320 |
| 2019 | $1,472 | $48,800 | $5,880 | $42,920 |
| 2018 | $1,472 | $48,800 | $5,880 | $42,920 |
| 2017 | $1,472 | $48,800 | $5,880 | $42,920 |
| 2016 | $1,373 | $47,514 | $5,880 | $41,634 |
| 2015 | $1,416 | $48,845 | $6,056 | $42,789 |
| 2014 | $1,323 | $45,711 | $6,056 | $39,655 |
| 2013 | -- | $47,773 | $6,056 | $41,717 |
Source: Public Records
Map
Nearby Homes
- 732 Camellia Dr
- 724 Camellia Dr
- 106 Ewing St
- 201 S Chilton Crescent
- 203 S Chilton Crescent
- 102 Beech Creek Dr
- 204 Dixie Creek Dr
- 204 Colonial St
- 110 Russell St
- 900 North St
- 806 New Franklin Rd
- 114 Briarcliff Rd
- 222 Beechwood Cir
- 109 Thomas St
- 219 Banks St
- 104 Sweetgum Dr
- 202 Park Hill Dr
- 134 S Page St
- 102 Dogwood Dr
- 910 Piney Woods Dr
- 928 Malibu Dr
- 924 Malibu Dr
- 933 Malibu Dr
- 939 Malibu Dr
- 1041 Mooty Bridge Rd
- 931 Malibu Dr
- 930 Malibu Dr
- 922 Malibu Dr
- 929 Malibu Dr
- 1043 Mooty Bridge Rd
- 930 Norwood Dr
- 932 Malibu Dr
- 927 Malibu Dr
- 943 Malibu Dr
- 928 Norwood Dr
- 932 Norwood Dr Unit 12A
- 932 Norwood Dr
- 934 Norwood Dr
- 101 Glendale Dr
- 1045 Mooty Bridge Rd
Your Personal Tour Guide
Ask me questions while you tour the home.