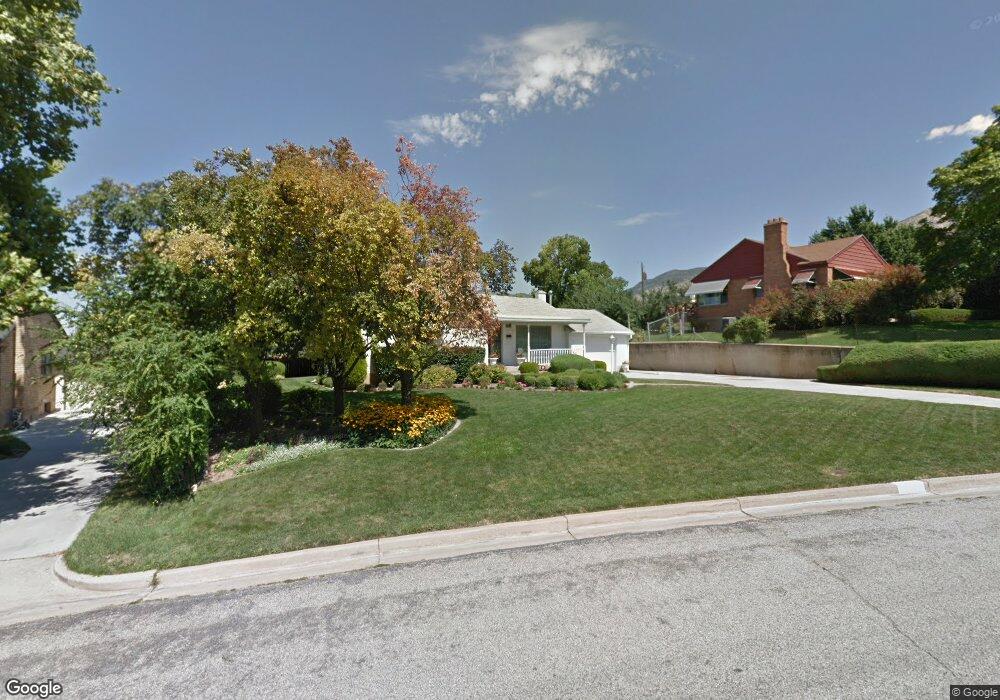
926 Maple St Ogden, UT 84403
Southeast Ogden NeighborhoodEstimated Value: $374,000 - $410,000
3
Beds
2
Baths
2,162
Sq Ft
$183/Sq Ft
Est. Value
About This Home
This home is located at 926 Maple St, Ogden, UT 84403 and is currently estimated at $394,882, approximately $182 per square foot. 926 Maple St is a home located in Weber County with nearby schools including Shadow Valley School, Mount Ogden Junior High School, and Ogden High School.
Ownership History
Date
Name
Owned For
Owner Type
Purchase Details
Closed on
Jul 15, 2014
Sold by
Clontz Brad H
Bought by
Tucker Ann
Current Estimated Value
Home Financials for this Owner
Home Financials are based on the most recent Mortgage that was taken out on this home.
Original Mortgage
$142,405
Outstanding Balance
$108,226
Interest Rate
4.1%
Mortgage Type
New Conventional
Estimated Equity
$286,656
Purchase Details
Closed on
Oct 14, 2001
Sold by
Clontz Wanda H
Bought by
Clontz Wanda H
Create a Home Valuation Report for This Property
The Home Valuation Report is an in-depth analysis detailing your home's value as well as a comparison with similar homes in the area
Home Values in the Area
Average Home Value in this Area
Purchase History
| Date | Buyer | Sale Price | Title Company |
|---|---|---|---|
| Tucker Ann | -- | First American | |
| Clontz Wanda H | -- | -- |
Source: Public Records
Mortgage History
| Date | Status | Borrower | Loan Amount |
|---|---|---|---|
| Open | Tucker Ann | $142,405 |
Source: Public Records
Tax History
| Year | Tax Paid | Tax Assessment Tax Assessment Total Assessment is a certain percentage of the fair market value that is determined by local assessors to be the total taxable value of land and additions on the property. | Land | Improvement |
|---|---|---|---|---|
| 2025 | $2,920 | $371,053 | $132,911 | $238,142 |
| 2024 | $2,899 | $199,649 | $73,101 | $126,548 |
| 2023 | $3,038 | $214,500 | $64,520 | $149,980 |
| 2022 | $3,386 | $245,300 | $55,816 | $189,484 |
| 2021 | $2,511 | $292,000 | $61,435 | $230,565 |
| 2020 | $2,359 | $252,000 | $46,084 | $205,916 |
| 2019 | $2,266 | $226,000 | $41,158 | $184,842 |
| 2018 | $2,062 | $202,000 | $36,110 | $165,890 |
| 2017 | $1,829 | $164,000 | $36,110 | $127,890 |
| 2016 | $1,627 | $77,369 | $16,811 | $60,558 |
| 2015 | $1,652 | $77,350 | $16,811 | $60,539 |
| 2014 | $1,451 | $65,715 | $16,811 | $48,904 |
Source: Public Records
Map
Nearby Homes
- 925 36th St
- 936 36th St
- 1004 36th St
- 1616 S Fowler Ave
- 3715 Van Buren Ave
- 1066 35th St
- 3828 Quincy Ave
- 1130 38th St
- 848 Franklin St
- 3856 Grandview Dr
- 904 39th St
- 3845 Nordin Ave
- 4615 S Monroe Blvd
- 3476 Brinker Ave
- 719 Bel Mar Dr
- 3913 Jackson Ave
- 3374 Eccles Ave
- 3878 Grandview Dr
- 668 37th St
- 3658 Jefferson Ave
Your Personal Tour Guide
Ask me questions while you tour the home.