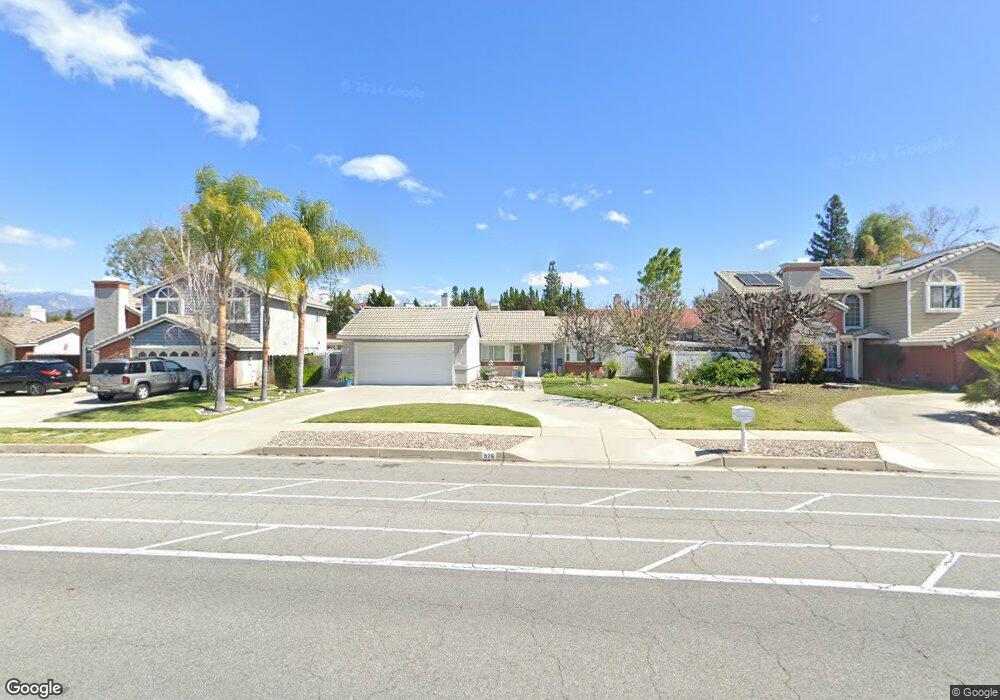
926 N Dearborn St Redlands, CA 92374
North Redlands NeighborhoodEstimated Value: $513,688 - $588,000
2
Beds
2
Baths
1,133
Sq Ft
$502/Sq Ft
Est. Value
About This Home
This home is located at 926 N Dearborn St, Redlands, CA 92374 and is currently estimated at $568,422, approximately $501 per square foot. 926 N Dearborn St is a home located in San Bernardino County with nearby schools including Crafton Elementary School, Clement Middle School, and Redlands East Valley High School.
Ownership History
Date
Name
Owned For
Owner Type
Purchase Details
Closed on
Oct 17, 2000
Sold by
Harvey Clinton V
Bought by
Harvey Paula R
Current Estimated Value
Purchase Details
Closed on
Oct 11, 2000
Sold by
Harvey Paula and The Clinton V & Paula R Harvey
Bought by
Spear John A and Spear Jill L
Purchase Details
Closed on
Jul 17, 2000
Sold by
Harvey Paula
Bought by
Harvey Paula R V and Harvey Clinton V
Purchase Details
Closed on
Jan 15, 1999
Sold by
Harvey Paula
Bought by
Harvey Paula R and The Paula R Havey 1998 Trust
Purchase Details
Closed on
Jun 12, 1995
Sold by
Beaumont Paul C and Hanson Gerald W
Bought by
Beaumont Paul C and Irons Beaumont Karen
Home Financials for this Owner
Home Financials are based on the most recent Mortgage that was taken out on this home.
Original Mortgage
$25,000
Interest Rate
8.37%
Create a Home Valuation Report for This Property
The Home Valuation Report is an in-depth analysis detailing your home's value as well as a comparison with similar homes in the area
Home Values in the Area
Average Home Value in this Area
Purchase History
| Date | Buyer | Sale Price | Title Company |
|---|---|---|---|
| Harvey Paula R | -- | Fidelity National Title | |
| Spear John A | $143,500 | Fidelity National Title | |
| Harvey Paula R V | -- | -- | |
| Harvey Paula R | -- | -- | |
| Harvey Paula R | -- | -- | |
| Beaumont Paul C | -- | United Title Company |
Source: Public Records
Mortgage History
| Date | Status | Borrower | Loan Amount |
|---|---|---|---|
| Previous Owner | Beaumont Paul C | $25,000 |
Source: Public Records
Tax History Compared to Growth
Tax History
| Year | Tax Paid | Tax Assessment Tax Assessment Total Assessment is a certain percentage of the fair market value that is determined by local assessors to be the total taxable value of land and additions on the property. | Land | Improvement |
|---|---|---|---|---|
| 2025 | $2,527 | $222,643 | $54,059 | $168,584 |
| 2024 | $2,527 | $218,277 | $52,999 | $165,278 |
| 2023 | $2,523 | $213,997 | $51,960 | $162,037 |
| 2022 | $2,485 | $209,801 | $50,941 | $158,860 |
| 2021 | $2,528 | $205,687 | $49,942 | $155,745 |
| 2020 | $2,490 | $203,578 | $49,430 | $154,148 |
| 2019 | $2,419 | $199,586 | $48,461 | $151,125 |
| 2018 | $2,358 | $195,673 | $47,511 | $148,162 |
| 2017 | $2,337 | $191,836 | $46,579 | $145,257 |
| 2016 | $2,309 | $188,075 | $45,666 | $142,409 |
| 2015 | $2,291 | $185,250 | $44,980 | $140,270 |
| 2014 | -- | $181,621 | $44,099 | $137,522 |
Source: Public Records
Map
Nearby Homes
- 907 Knightsbridge Ln
- 941 Kensington Dr
- 1573 E Brockton Ave
- 1529 Cambridge Ave
- 1639 E Brockton Ave
- 1141 Via Antibes
- 1683 E Brockton Ave
- 1107 Via San Remo
- 0 E Colton Ave
- 1721 E Colton Ave Unit 38
- 1721 E Colton Ave Unit 119
- 1721 E Colton Ave Unit 89
- 1721 E Colton Ave Unit 103
- 1721 E Colton Ave Unit 106
- 1721 E Colton Ave Unit 82
- 1231 Via Antibes
- 1226 Via Palermo
- 626 N Dearborn St Unit 9
- 626 N Dearborn St Unit 192
- 626 N Dearborn St Unit 12
- 930 N Dearborn St
- 922 N Dearborn St
- 927 Knightsbridge Ln
- 923 Knightsbridge Ln
- 934 N Dearborn St
- 918 N Dearborn St
- 931 Knightsbridge Ln
- 919 Knightsbridge Ln
- 1572 Clock St
- 938 N Dearborn St
- 914 N Dearborn St
- 1573 Clock St
- 915 Knightsbridge Ln
- 1017 Jasmine St
- 1568 Clock Ave
- 935 Knightsbridge Ln
- 1568 Clock St
- 910 N Dearborn St
- 942 N Dearborn St
- 1569 Cambridge Ave