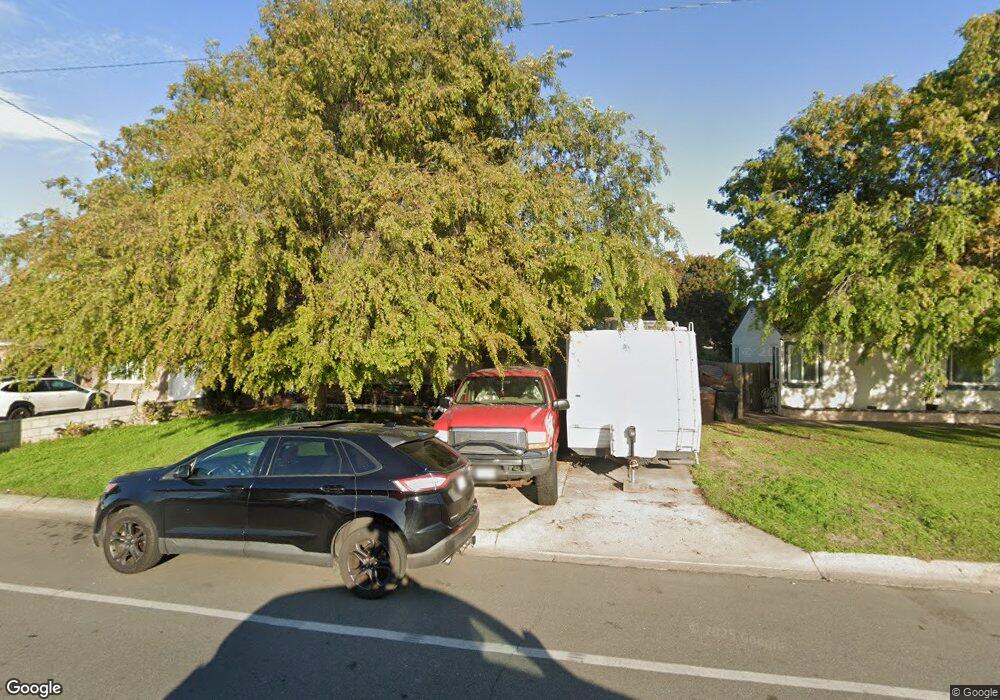
926 N Moraga St Anaheim, CA 92801
Northwest Anaheim NeighborhoodEstimated Value: $723,000 - $842,000
3
Beds
1
Bath
1,203
Sq Ft
$668/Sq Ft
Est. Value
About This Home
This home is located at 926 N Moraga St, Anaheim, CA 92801 and is currently estimated at $803,634, approximately $668 per square foot. 926 N Moraga St is a home located in Orange County with nearby schools including Melbourne A. Gauer Elementary School, Brookhurst Junior High School, and Savanna High School.
Ownership History
Date
Name
Owned For
Owner Type
Purchase Details
Closed on
Oct 3, 2019
Sold by
Allison George and Allison George Elton
Bought by
Allison George Elton and George Elton Allison Jr Trust
Current Estimated Value
Purchase Details
Closed on
Jul 18, 2008
Sold by
The Bank Of New York Trust Co Na
Bought by
Allison George and Allison Emma
Home Financials for this Owner
Home Financials are based on the most recent Mortgage that was taken out on this home.
Original Mortgage
$195,000
Outstanding Balance
$127,322
Interest Rate
6.31%
Mortgage Type
Purchase Money Mortgage
Estimated Equity
$676,312
Purchase Details
Closed on
Nov 14, 2007
Sold by
Perez Pedro
Bought by
The Bank Of New York Trust Co Na and Jp Morgan Chase Bank Na
Purchase Details
Closed on
Dec 7, 2004
Sold by
Wesley Melanie
Bought by
Perez Pedro
Home Financials for this Owner
Home Financials are based on the most recent Mortgage that was taken out on this home.
Original Mortgage
$345,600
Interest Rate
6.57%
Mortgage Type
Purchase Money Mortgage
Create a Home Valuation Report for This Property
The Home Valuation Report is an in-depth analysis detailing your home's value as well as a comparison with similar homes in the area
Home Values in the Area
Average Home Value in this Area
Purchase History
| Date | Buyer | Sale Price | Title Company |
|---|---|---|---|
| Allison George Elton | -- | None Available | |
| Allison George | $275,000 | First American Title Ins Co | |
| The Bank Of New York Trust Co Na | $450,000 | None Available | |
| Perez Pedro | $432,000 | Ticor Title Company Of Ca |
Source: Public Records
Mortgage History
| Date | Status | Borrower | Loan Amount |
|---|---|---|---|
| Open | Allison George | $195,000 | |
| Previous Owner | Perez Pedro | $345,600 | |
| Closed | Perez Pedro | $86,400 |
Source: Public Records
Tax History Compared to Growth
Tax History
| Year | Tax Paid | Tax Assessment Tax Assessment Total Assessment is a certain percentage of the fair market value that is determined by local assessors to be the total taxable value of land and additions on the property. | Land | Improvement |
|---|---|---|---|---|
| 2025 | $4,206 | $354,125 | $293,624 | $60,501 |
| 2024 | $4,206 | $347,182 | $287,867 | $59,315 |
| 2023 | $4,117 | $340,375 | $282,223 | $58,152 |
| 2022 | $4,064 | $333,701 | $276,689 | $57,012 |
| 2021 | $4,070 | $327,158 | $271,263 | $55,895 |
| 2020 | $4,052 | $323,804 | $268,482 | $55,322 |
| 2019 | $3,934 | $317,455 | $263,217 | $54,238 |
| 2018 | $3,854 | $311,231 | $258,056 | $53,175 |
| 2017 | $3,704 | $305,129 | $252,996 | $52,133 |
| 2016 | $3,693 | $299,147 | $248,036 | $51,111 |
| 2015 | $3,660 | $294,654 | $244,310 | $50,344 |
| 2014 | $3,438 | $288,883 | $239,525 | $49,358 |
Source: Public Records
Map
Nearby Homes
- 947 N Alamo St
- 1012 N Doria St
- 728 N Geneva St
- 615 N Ventura St
- 1006 N Hampton Place
- 525 N Gilbert St Unit 106
- 525 N Gilbert St Unit 151
- 1028 N Mayflower St
- 2544 W Greenacre Ave
- 615 615 W Romneya
- 2179 W Brownwood Ave
- 300 N Ranchito St
- 1360 N Ferndale St
- 2030 W Dogwood Ave
- 2625 W Cameron Ct Unit 121
- 224 N Bircher St
- 2012 W Dogwood Ave
- 1984 W Catalpa Ave
- 527 N Dartmouth Way Unit 40
- 8213 Woodland Dr Unit 40
- 930 N Moraga St
- 922 N Moraga St
- 927 N Alamo St
- 918 N Moraga St
- 934 N Moraga St
- 923 N Alamo St
- 2300 W Moro Place
- 2336 W Moro Place
- 919 N Alamo St
- 935 N Alamo St
- 938 N Moraga St
- 914 N Moraga St
- 935 N Moraga St
- 2337 W Valdina Ave
- 915 N Alamo St
- 939 N Alamo St
- 2340 W Moro Place
- 942 N Moraga St
- 939 N Moraga St Unit B
- 939 N Moraga St