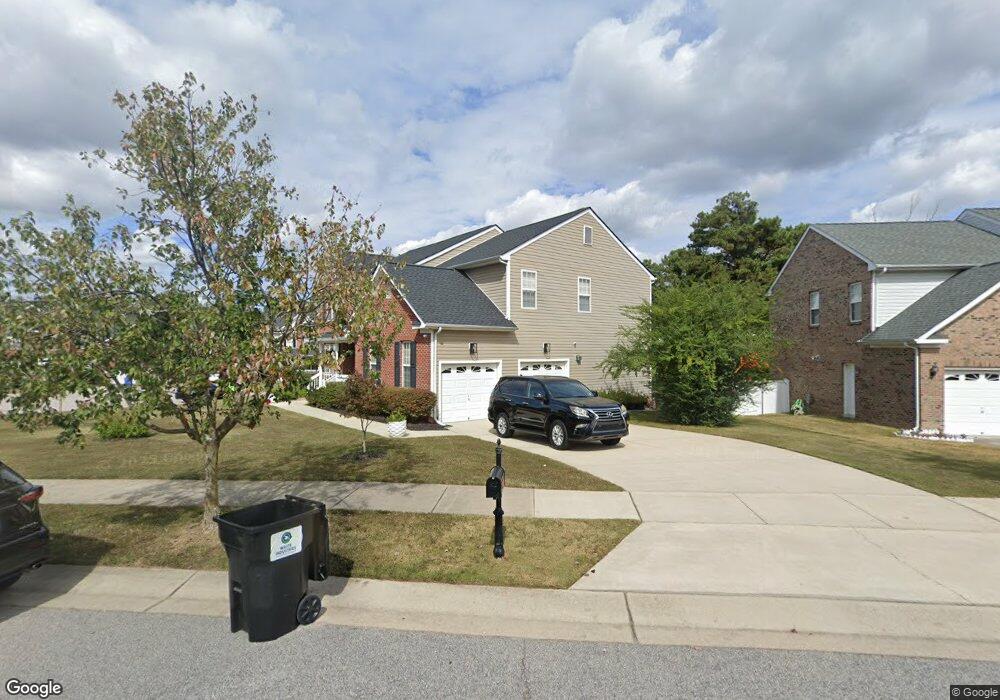
926 Pristine Ln Rolesville, NC 27571
Estimated Value: $477,000 - $536,000
5
Beds
3
Baths
3,008
Sq Ft
$165/Sq Ft
Est. Value
About This Home
This home is located at 926 Pristine Ln, Rolesville, NC 27571 and is currently estimated at $495,421, approximately $164 per square foot. 926 Pristine Ln is a home located in Wake County with nearby schools including Sanford Creek Elementary School, Rolesville Middle School, and Rolesville High School.
Ownership History
Date
Name
Owned For
Owner Type
Purchase Details
Closed on
Sep 14, 2020
Sold by
Plihal Martin P and Plihal Ivana
Bought by
Jackson Ronald D and Mccarty Anita M
Current Estimated Value
Home Financials for this Owner
Home Financials are based on the most recent Mortgage that was taken out on this home.
Original Mortgage
$326,000
Outstanding Balance
$288,101
Interest Rate
2.8%
Mortgage Type
New Conventional
Estimated Equity
$207,320
Purchase Details
Closed on
Aug 30, 2006
Sold by
Hampton Pointe Associates Llc
Bought by
Plihal Martin P and Plihal Ivana
Home Financials for this Owner
Home Financials are based on the most recent Mortgage that was taken out on this home.
Original Mortgage
$219,000
Interest Rate
8.25%
Mortgage Type
Purchase Money Mortgage
Create a Home Valuation Report for This Property
The Home Valuation Report is an in-depth analysis detailing your home's value as well as a comparison with similar homes in the area
Purchase History
| Date | Buyer | Sale Price | Title Company |
|---|---|---|---|
| Jackson Ronald D | $324,000 | None Available | |
| Plihal Martin P | $274,000 | None Available |
Source: Public Records
Mortgage History
| Date | Status | Borrower | Loan Amount |
|---|---|---|---|
| Open | Jackson Ronald D | $326,000 | |
| Previous Owner | Plihal Martin P | $219,000 |
Source: Public Records
Tax History
| Year | Tax Paid | Tax Assessment Tax Assessment Total Assessment is a certain percentage of the fair market value that is determined by local assessors to be the total taxable value of land and additions on the property. | Land | Improvement |
|---|---|---|---|---|
| 2025 | $4,573 | $463,713 | $100,000 | $363,713 |
| 2024 | $4,556 | $463,713 | $100,000 | $363,713 |
Source: Public Records
Map
Nearby Homes
- 4804 Pine Glen Ct
- 708 Quiet Walk Cir
- 609 Marshskip Way Unit 5
- 607 Marshskip Way Unit 4
- 603 Marshskip Way
- 703 Jamescroft Way Unit 13
- 707 Jamescroft Way Unit 15
- 610 Marshskip Way Unit 22
- 608 Marshskip Way Unit 23
- 4917 Huntmaster Trail
- 752 Strathwood Way
- 503 Bendemeer Ln
- 4225 Burlington Mills Rd
- 391 Virginia Water Dr
- 200 Kellygreen Ct
- 905 Shefford Town Dr
- 2464 Everstone Rd
- 2621 Silver Gate Ct
- 2617 Silver Gate Ct
- 2625 Silver Gate Ct
- 922 Pristine Ln
- 202 Timeless Cir
- 920 Pristine Ln
- 204 Timeless Cir
- 930 Pristine Ln
- 925 Pristine Ln
- 203 Timeless Cir
- 927 Pristine Ln
- 923 Pristine Ln
- 918 Pristinee Ln
- 201 Belladonna Cir
- 929 Pristine Ln
- 918 Pristine Ln
- 921 Pristine Ln
- 932 Pristine Ln
- 203 Belladonna Cir
- 931 Pristine Ln
- 933 Pristine Ln
- 919 Pristine Ln
- 205 Belladonna Cir