926 Rodman St Fall River, MA 02721
Niagara NeighborhoodEstimated Value: $769,000 - $847,000
About This Home
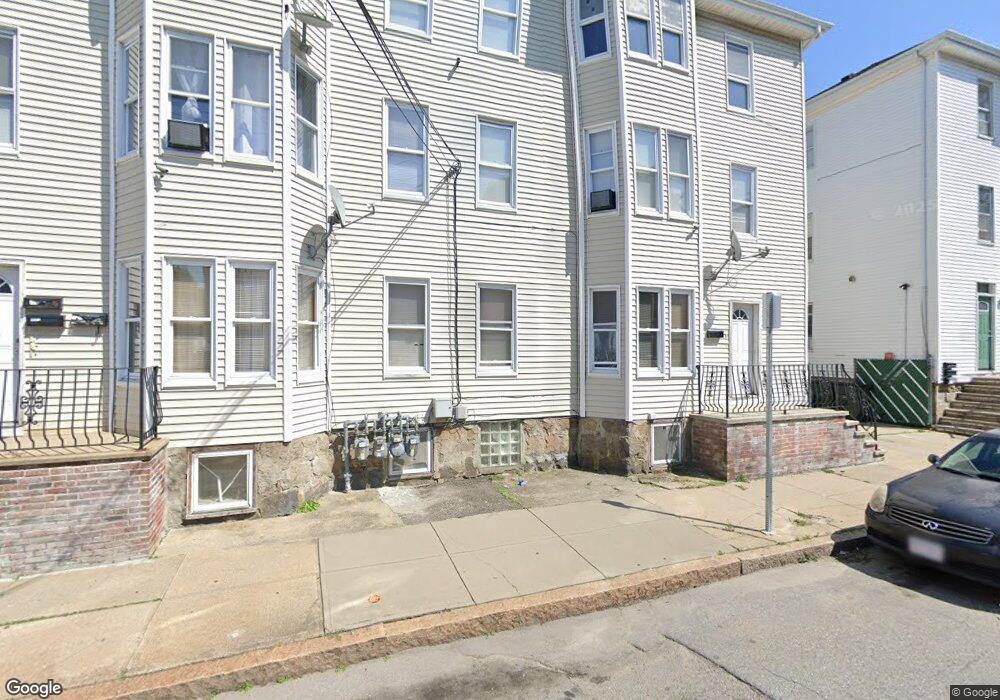
This home is located at 926 Rodman St, Fall River, MA 02721 and is currently estimated at $808,000, approximately $173 per square foot. 926 Rodman St is a home located in Bristol County with nearby schools including William S Greene, Talbot Innovation School, and B M C Durfee High School.
Ownership History
We collect this data history from publicly available records. To have your information removed, we recommend requesting removal directly through your county’s website.
Purchase Details
Purchase Details
Home Values in the Area
Average Home Value in this Area
Purchase History
We collect this data history from publicly available records. To have your information removed, we recommend requesting removal directly through your county’s website.
| Date | Buyer | Sale Price | Title Company |
|---|---|---|---|
| -- | -- | ||
| $97,000 | -- |
Mortgage History
We collect this data history from publicly available records. To have your information removed, we recommend requesting removal directly through your county’s website.
| Date | Status | Borrower | Loan Amount |
|---|---|---|---|
| Open | $15,000 | ||
| Previous Owner | $126,000 | ||
| Previous Owner | $65,000 | ||
| Previous Owner | $60,900 |
Tax History
We collect this data history from publicly available records. To have your information removed, we recommend requesting removal directly through your county’s website.
| Year | Tax Paid | Tax Assessment Tax Assessment Total Assessment is a certain percentage of the fair market value that is determined by local assessors to be the total taxable value of land and additions on the property. | Land | Improvement |
|---|---|---|---|---|
| 2025 | $8,120 | $709,200 | $101,700 | $607,500 |
| 2024 | $7,720 | $671,900 | $94,900 | $577,000 |
| 2023 | $6,790 | $553,400 | $79,700 | $473,700 |
| 2022 | $5,965 | $472,700 | $75,800 | $396,900 |
| 2021 | $5,583 | $403,700 | $72,600 | $331,100 |
| 2020 | $4,913 | $340,000 | $70,200 | $269,800 |
| 2019 | $4,141 | $284,000 | $70,200 | $213,800 |
| 2018 | $3,876 | $265,100 | $73,600 | $191,500 |
| 2017 | $3,711 | $265,100 | $73,600 | $191,500 |
| 2016 | $3,489 | $256,000 | $69,400 | $186,600 |
| 2015 | $3,348 | $256,000 | $69,400 | $186,600 |
| 2014 | $3,493 | $277,700 | $73,000 | $204,700 |
Map
- 90 Augustus St
- 518 Snell St
- 000 Lawrence St
- 1-11 Lawrence St
- 87 Smith St
- 529 Warren St
- 582 Cambridge St
- 52 Lapham St
- 847 Pleasant St
- 1350 Rodman St
- 147 Jefferson St
- 544 Plymouth Ave
- 883 Grinnell St
- 889 Grinnell St Unit 2
- 545 Brayton Ave
- 25 Lebanon St Unit C
- 25 Lebanon St Unit D
- 274 Harrison St
- 1155-1157 Pleasant St
- 182 Quequechan St
- 18 Augustus St
- 898 Rodman St
- 886 Rodman St
- 880 Rodman St
- 916 Rodman St Unit 922
- 34 Roy St
- 34 Roy St Unit 1-2
- 34 Roy St Unit 1-6
- 41 Michael St
- 48 Augustus St
- 27 Michael St
- 901 Rodman St Unit 2
- 901 Rodman St
- 901 Rodman St
- 34 Roy St
- 903 Rodman St
- 913 Rodman St Unit 2S
- 913 Rodman St Unit 3S
- 913 Rodman St Unit 1N
- 913 Rodman St Unit 3N
Ask me questions while you tour the home.