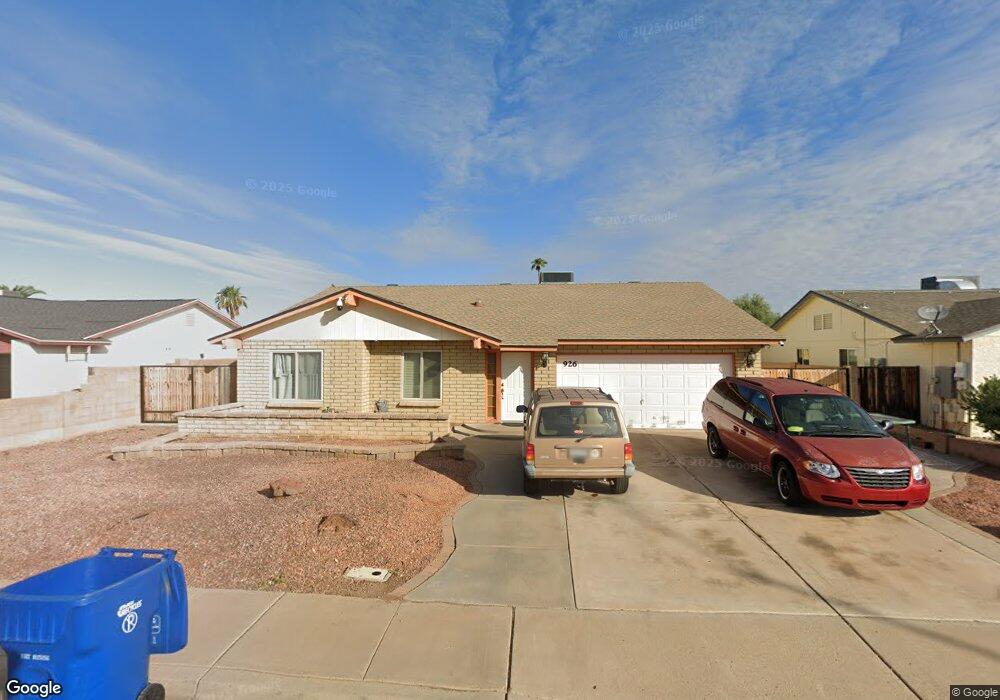
926 W Los Lagos Vista Ave Mesa, AZ 85210
Dobson NeighborhoodEstimated Value: $461,000 - $551,000
--
Bed
2
Baths
2,221
Sq Ft
$223/Sq Ft
Est. Value
About This Home
This home is located at 926 W Los Lagos Vista Ave, Mesa, AZ 85210 and is currently estimated at $496,209, approximately $223 per square foot. 926 W Los Lagos Vista Ave is a home located in Maricopa County with nearby schools including Crismon Elementary School, Franklin at Brimhall Elementary School, and Franklin Accelerated Academy Jordan Campus.
Ownership History
Date
Name
Owned For
Owner Type
Purchase Details
Closed on
Sep 26, 2005
Sold by
Hall Eric G
Bought by
Hall Eric G and Hall Lisa M
Current Estimated Value
Home Financials for this Owner
Home Financials are based on the most recent Mortgage that was taken out on this home.
Original Mortgage
$45,000
Interest Rate
5.72%
Mortgage Type
New Conventional
Purchase Details
Closed on
Mar 14, 2005
Sold by
Hall Eric G and Hall Lisa M
Bought by
Hall Eric G
Home Financials for this Owner
Home Financials are based on the most recent Mortgage that was taken out on this home.
Original Mortgage
$117,700
Outstanding Balance
$59,354
Interest Rate
5.53%
Mortgage Type
New Conventional
Estimated Equity
$436,855
Purchase Details
Closed on
Oct 3, 2000
Sold by
Odowd Cynthia L
Bought by
Hall Eric G
Home Financials for this Owner
Home Financials are based on the most recent Mortgage that was taken out on this home.
Original Mortgage
$116,750
Interest Rate
8.01%
Mortgage Type
Seller Take Back
Create a Home Valuation Report for This Property
The Home Valuation Report is an in-depth analysis detailing your home's value as well as a comparison with similar homes in the area
Home Values in the Area
Average Home Value in this Area
Purchase History
| Date | Buyer | Sale Price | Title Company |
|---|---|---|---|
| Hall Eric G | -- | -- | |
| Hall Eric G | -- | Placer Title Company | |
| Hall Eric G | $122,900 | Transnation Title Insurance |
Source: Public Records
Mortgage History
| Date | Status | Borrower | Loan Amount |
|---|---|---|---|
| Closed | Hall Eric G | $45,000 | |
| Open | Hall Eric G | $117,700 | |
| Closed | Hall Eric G | $116,750 |
Source: Public Records
Tax History Compared to Growth
Tax History
| Year | Tax Paid | Tax Assessment Tax Assessment Total Assessment is a certain percentage of the fair market value that is determined by local assessors to be the total taxable value of land and additions on the property. | Land | Improvement |
|---|---|---|---|---|
| 2025 | $2,159 | $25,995 | -- | -- |
| 2024 | $2,182 | $24,757 | -- | -- |
| 2023 | $2,182 | $41,560 | $8,310 | $33,250 |
| 2022 | $2,134 | $31,570 | $6,310 | $25,260 |
| 2021 | $2,193 | $29,100 | $5,820 | $23,280 |
| 2020 | $2,164 | $27,510 | $5,500 | $22,010 |
| 2019 | $2,004 | $25,480 | $5,090 | $20,390 |
| 2018 | $1,914 | $24,120 | $4,820 | $19,300 |
| 2017 | $1,854 | $23,150 | $4,630 | $18,520 |
| 2016 | $1,187 | $15,980 | $3,190 | $12,790 |
| 2015 | $1,121 | $14,570 | $2,910 | $11,660 |
Source: Public Records
Map
Nearby Homes
- 906 W Kiowa Ave
- 2156 S Emerson
- 1005 W Madero Ave
- 945 W Mendoza Ave
- 1942 S Emerson Unit 130
- 1942 S Emerson Unit 238
- 1942 S Emerson Unit 107
- 643 W Medina Ave
- 1160 W Madero Cir
- 1114 W Meseto Ave
- 1930 S Beverly
- 2522 S Spruce
- 563 W Kilarea Ave
- 1255 W Baseline Rd Unit B139
- 1850 S Westwood Unit 39
- 1231 W Baseline Rd
- 1841 S Spruce
- 1331 W Baseline Rd Unit 167
- 1331 W Baseline Rd Unit 251
- 1331 W Baseline Rd Unit 148
- 920 W Los Lagos Vista Ave Unit 2
- 930 W Los Lagos Vista Ave
- 917 W Kiowa Ave
- 915 W Kiowa Ave
- 914 W Los Lagos Vista Ave
- 919 W Kiowa Ave
- 925 W Los Lagos Vista Ave
- 931 W Los Lagos Vista Ave
- 911 W Kiowa Ave
- 932 W Los Lagos Vista Ave
- 917 W Los Lagos Vista Ave
- 925 W Kiowa Ave
- 936 W Los Lagos Vista Ave
- 908 W Los Lagos Vista Ave
- 909 W Kiowa Ave
- 2214 S Davis
- 909 W Los Lagos Vista Ave
- 940 W Los Lagos Vista Ave
- 924 W Laguna Azul Ave
- 918 W Kiowa Ave