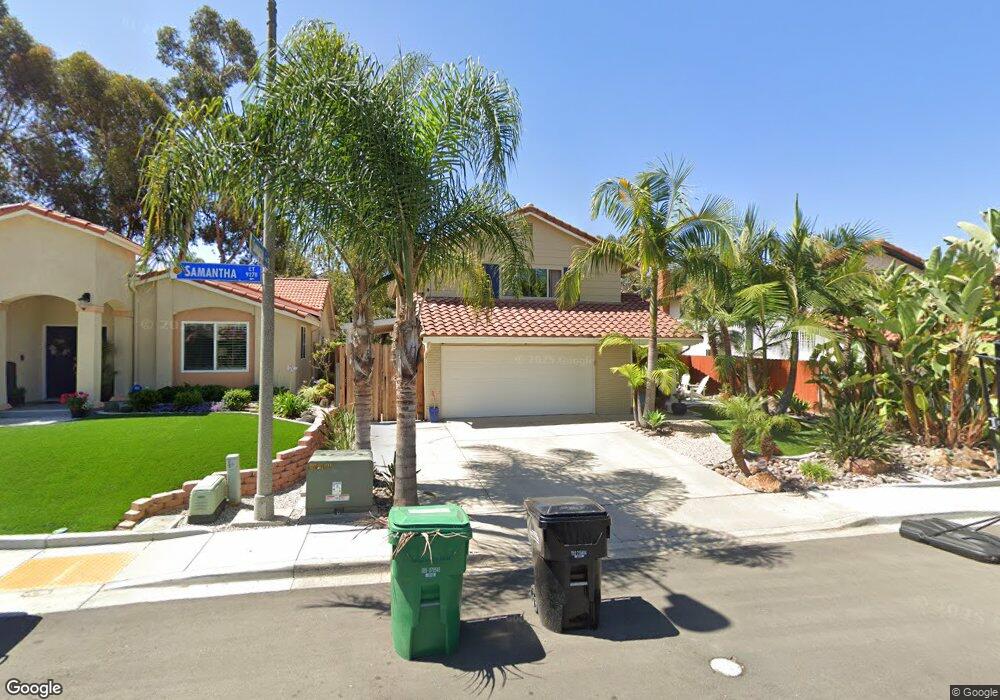
9265 Samantha Ct San Diego, CA 92129
Rancho Peñasquitos NeighborhoodEstimated Value: $1,336,300 - $1,388,000
4
Beds
3
Baths
1,864
Sq Ft
$730/Sq Ft
Est. Value
About This Home
This home is located at 9265 Samantha Ct, San Diego, CA 92129 and is currently estimated at $1,361,575, approximately $730 per square foot. 9265 Samantha Ct is a home located in San Diego County with nearby schools including Sundance Elementary School, Mesa Verde Middle School, and Westview High School.
Ownership History
Date
Name
Owned For
Owner Type
Purchase Details
Closed on
Nov 12, 2009
Sold by
Hayman Christopher J and Hayman Elizabeth
Bought by
Fortune Graham and Fortune Erin
Current Estimated Value
Home Financials for this Owner
Home Financials are based on the most recent Mortgage that was taken out on this home.
Original Mortgage
$463,931
Outstanding Balance
$310,577
Interest Rate
5.5%
Mortgage Type
FHA
Estimated Equity
$1,050,998
Purchase Details
Closed on
Nov 18, 1997
Sold by
North American Mtg Company
Bought by
Hayman Christopher J and Hayman Elizabeth
Home Financials for this Owner
Home Financials are based on the most recent Mortgage that was taken out on this home.
Original Mortgage
$192,780
Interest Rate
7.23%
Mortgage Type
VA
Purchase Details
Closed on
Apr 17, 1997
Sold by
Dizon Homer E and Dizon Victoria O
Bought by
North American Mtg Company
Purchase Details
Closed on
Jun 6, 1991
Create a Home Valuation Report for This Property
The Home Valuation Report is an in-depth analysis detailing your home's value as well as a comparison with similar homes in the area
Home Values in the Area
Average Home Value in this Area
Purchase History
| Date | Buyer | Sale Price | Title Company |
|---|---|---|---|
| Fortune Graham | $480,000 | Chicago Title Company | |
| Hayman Christopher J | $189,000 | Guardian Title | |
| North American Mtg Company | $179,500 | American Title Ins Co | |
| -- | $206,500 | -- |
Source: Public Records
Mortgage History
| Date | Status | Borrower | Loan Amount |
|---|---|---|---|
| Open | Fortune Graham | $463,931 | |
| Previous Owner | Hayman Christopher J | $192,780 |
Source: Public Records
Tax History Compared to Growth
Tax History
| Year | Tax Paid | Tax Assessment Tax Assessment Total Assessment is a certain percentage of the fair market value that is determined by local assessors to be the total taxable value of land and additions on the property. | Land | Improvement |
|---|---|---|---|---|
| 2025 | $6,818 | $619,580 | $210,713 | $408,867 |
| 2024 | $6,818 | $607,432 | $206,582 | $400,850 |
| 2023 | $6,671 | $595,523 | $202,532 | $392,991 |
| 2022 | $6,557 | $583,847 | $198,561 | $385,286 |
| 2021 | $6,469 | $572,400 | $194,668 | $377,732 |
| 2020 | $6,381 | $566,531 | $192,672 | $373,859 |
| 2019 | $6,214 | $555,424 | $188,895 | $366,529 |
| 2018 | $6,037 | $544,535 | $185,192 | $359,343 |
| 2017 | $83 | $533,859 | $181,561 | $352,298 |
| 2016 | $5,752 | $523,392 | $178,001 | $345,391 |
| 2015 | $5,665 | $515,531 | $175,328 | $340,203 |
| 2014 | $5,530 | $505,433 | $171,894 | $333,539 |
Source: Public Records
Map
Nearby Homes
- 13445 Appalachian Way
- 13411 Appalachian Way
- 13640 Via Cima Bella
- 9302 Twin Trails Dr Unit 204
- 9555 Via Pereza
- 9458 Twin Trails Dr Unit 205
- 9488 Hiker Hill Rd
- 8730 Twin Trails Dr
- 9342 Twin Trails Dr Unit 303
- 13292 Salmon River Rd Unit 204
- 13202 Salmon River Rd Unit 101
- 13146 Thunderhead St
- 13907 Bruyere Ct
- 9525 High Park Ln
- 9858 Via Caceres
- 9446 Pipilo St
- 9720 Graceland Way
- 9525 Vervain St
- 13856 Paseo Cardiel
- 9958 Paseo Montalban
- 9273 Samantha Ct
- 9257 Samantha Ct
- 9281 Samantha Ct
- 9249 Samantha Ct
- 9241 Samantha Ct
- 9289 Samantha Ct
- 9252 Samantha Ct
- 9262 Samantha Ct
- 9233 Samantha Ct
- 9242 Samantha Ct
- 9126 Togan Ave
- 9120 Togan Ave
- 9132 Togan Ave
- 9272 Samantha Ct
- 9112 Togan Ave
- 9232 Samantha Ct
- 9297 Samantha Ct
- 9136 Togan Ave
- 9292 Samantha Ct
- 9282 Samantha Ct