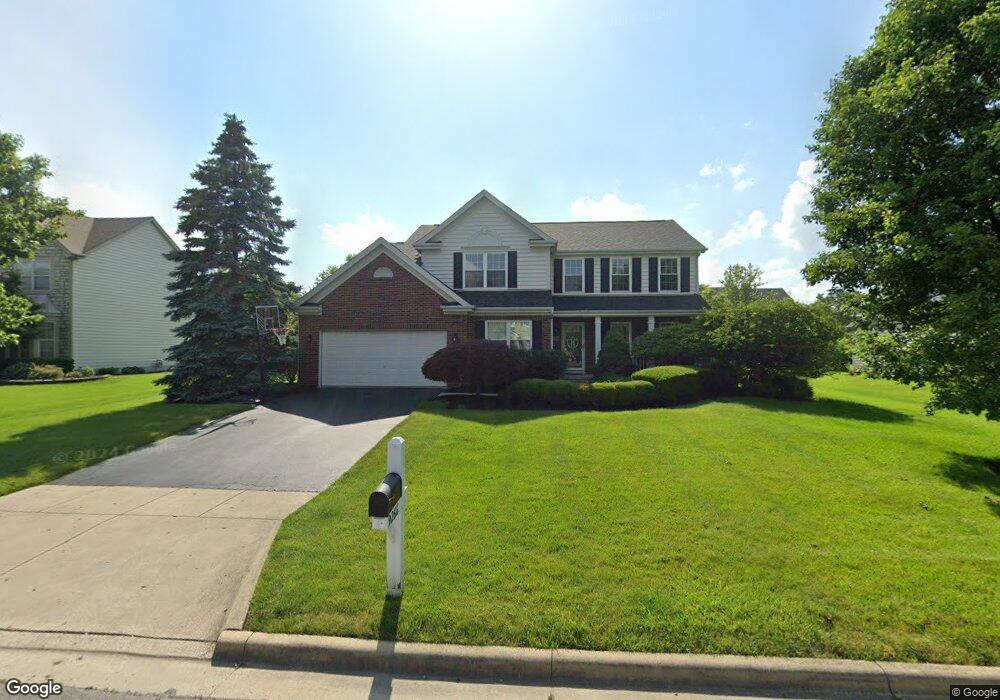
9266 Marlebury End Powell, OH 43065
Liberty Township NeighborhoodEstimated Value: $596,000 - $653,000
4
Beds
4
Baths
3,312
Sq Ft
$187/Sq Ft
Est. Value
About This Home
This home is located at 9266 Marlebury End, Powell, OH 43065 and is currently estimated at $619,118, approximately $186 per square foot. 9266 Marlebury End is a home located in Delaware County with nearby schools including Scioto Ridge Elementary School, Olentangy Liberty Middle School, and Olentangy Liberty High School.
Ownership History
Date
Name
Owned For
Owner Type
Purchase Details
Closed on
Jun 25, 2008
Sold by
Mroczkowski Robin and Fox Jeffrey M
Bought by
Kern Brian L and Kern Tami R
Current Estimated Value
Home Financials for this Owner
Home Financials are based on the most recent Mortgage that was taken out on this home.
Original Mortgage
$333,680
Outstanding Balance
$212,200
Interest Rate
5.96%
Mortgage Type
Purchase Money Mortgage
Estimated Equity
$406,918
Purchase Details
Closed on
Jul 26, 2004
Sold by
Splain Jeffrey A and Splain Tamara Z
Bought by
Mroczkowski Robin
Home Financials for this Owner
Home Financials are based on the most recent Mortgage that was taken out on this home.
Original Mortgage
$200,000
Interest Rate
6.34%
Mortgage Type
Purchase Money Mortgage
Purchase Details
Closed on
Jan 7, 2002
Sold by
M/I Schottenstein Homes
Bought by
Splain Jeffrey A and Splain Tamara Z
Home Financials for this Owner
Home Financials are based on the most recent Mortgage that was taken out on this home.
Original Mortgage
$240,900
Interest Rate
6.87%
Mortgage Type
New Conventional
Create a Home Valuation Report for This Property
The Home Valuation Report is an in-depth analysis detailing your home's value as well as a comparison with similar homes in the area
Home Values in the Area
Average Home Value in this Area
Purchase History
| Date | Buyer | Sale Price | Title Company |
|---|---|---|---|
| Kern Brian L | $344,000 | Title First | |
| Mroczkowski Robin | $325,000 | The Midland Celtic Title Gro | |
| Splain Jeffrey A | $283,519 | -- |
Source: Public Records
Mortgage History
| Date | Status | Borrower | Loan Amount |
|---|---|---|---|
| Open | Kern Brian L | $333,680 | |
| Closed | Mroczkowski Robin | $200,000 | |
| Previous Owner | Splain Jeffrey A | $240,900 |
Source: Public Records
Tax History Compared to Growth
Tax History
| Year | Tax Paid | Tax Assessment Tax Assessment Total Assessment is a certain percentage of the fair market value that is determined by local assessors to be the total taxable value of land and additions on the property. | Land | Improvement |
|---|---|---|---|---|
| 2024 | $9,161 | $174,410 | $37,630 | $136,780 |
| 2023 | $9,197 | $174,410 | $37,630 | $136,780 |
| 2022 | $8,554 | $128,590 | $24,500 | $104,090 |
| 2021 | $8,606 | $128,590 | $24,500 | $104,090 |
| 2020 | $8,647 | $128,590 | $24,500 | $104,090 |
| 2019 | $7,800 | $120,890 | $24,500 | $96,390 |
| 2018 | $7,831 | $120,890 | $24,500 | $96,390 |
| 2017 | $7,744 | $110,150 | $20,160 | $89,990 |
| 2016 | $7,590 | $110,150 | $20,160 | $89,990 |
| 2015 | $6,865 | $110,150 | $20,160 | $89,990 |
| 2014 | $6,960 | $110,150 | $20,160 | $89,990 |
| 2013 | $6,951 | $107,520 | $20,160 | $87,360 |
Source: Public Records
Map
Nearby Homes
- 9182 Marlebury End
- 9406 Cadogan Ct
- 4162 Pyke Dr
- 384 Park Woods Ln
- 3801 Orchard Way
- 3899 Hampshire Ave
- 324 Park Woods Ln
- 3750 Echo Place Unit 3750
- 3862 Foresta Grand Dr
- 4457 Quail Landing
- 9529 Wayne Brown Dr
- 3697 Stoneway Point Unit 83697
- 3717 Stoneway Point Unit 3717
- 9038 Courtside Ln
- 3603 Stoneway Point
- 3669 Stoneway Point Unit 53669
- 3751 Stoneway Point
- 67 Traditions Way
- 11 Murphys View Place
- 7356 Celebration Dr
- 9252 Marlebury End
- 9280 Marlebury End
- 9275 Addington Place
- 9261 Addington Place
- 9289 Addington Place
- 9265 Marlebury End
- 9240 Marlebury End
- 9294 Marlebury End
- 9281 Marlebury End
- 9247 Marlebury End
- 9245 Addington Place
- 9301 Addington Place
- 9293 Marlebury End
- 9230 Marlebury End
- 9225 Marlebury End
- 9231 Addington Place
- 9262 Audley End
- 9276 Addington Place
- 9260 Addington Place
- 9290 Addington Place