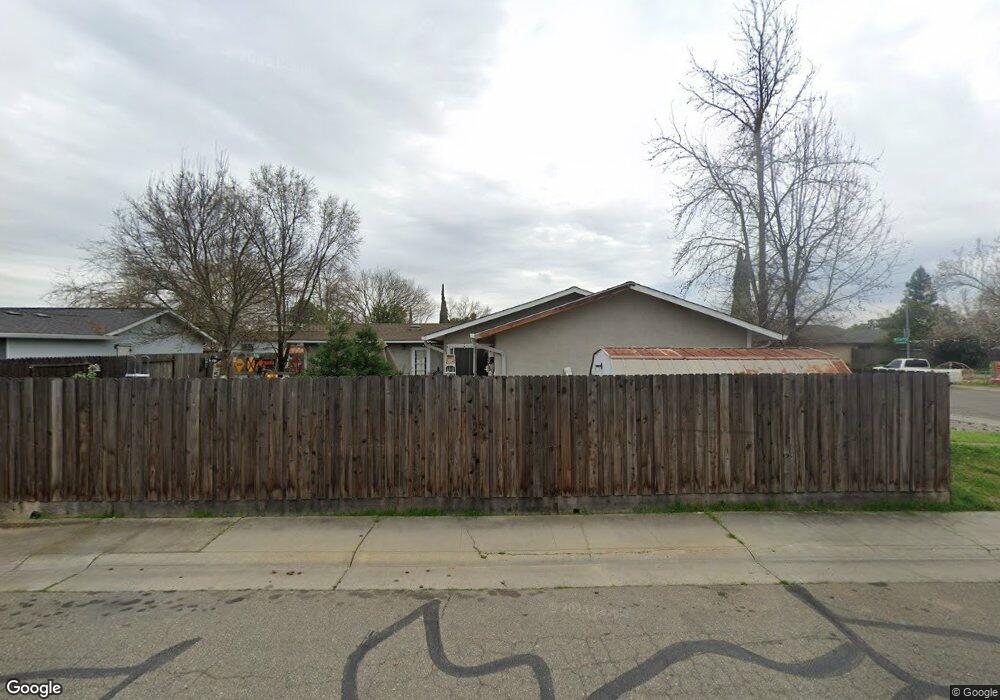
9267 Los Torres Dr Elk Grove, CA 95624
North East Elk Grove NeighborhoodEstimated Value: $436,000 - $493,000
4
Beds
2
Baths
1,752
Sq Ft
$264/Sq Ft
Est. Value
About This Home
This home is located at 9267 Los Torres Dr, Elk Grove, CA 95624 and is currently estimated at $463,356, approximately $264 per square foot. 9267 Los Torres Dr is a home located in Sacramento County with nearby schools including James A. McKee Elementary School, Joseph Kerr Middle School, and Elk Grove High School.
Ownership History
Date
Name
Owned For
Owner Type
Purchase Details
Closed on
Sep 18, 2007
Sold by
Whitlow Jeanne L and The Whitlow Family Trust
Bought by
Collins Christopher and Collins Jenipher
Current Estimated Value
Home Financials for this Owner
Home Financials are based on the most recent Mortgage that was taken out on this home.
Original Mortgage
$250,000
Outstanding Balance
$158,283
Interest Rate
6.57%
Mortgage Type
Seller Take Back
Estimated Equity
$305,073
Purchase Details
Closed on
Aug 28, 2000
Sold by
Whitlow Jeanne L
Bought by
Whitlow Jeanne L and Whitlow Family Trust
Purchase Details
Closed on
Jun 15, 2000
Sold by
Weber Mary Jane
Bought by
Whitlow Robert T and Whitlow Jeanne L
Home Financials for this Owner
Home Financials are based on the most recent Mortgage that was taken out on this home.
Original Mortgage
$70,000
Interest Rate
3.95%
Create a Home Valuation Report for This Property
The Home Valuation Report is an in-depth analysis detailing your home's value as well as a comparison with similar homes in the area
Home Values in the Area
Average Home Value in this Area
Purchase History
| Date | Buyer | Sale Price | Title Company |
|---|---|---|---|
| Collins Christopher | $250,000 | Alliance Title Company | |
| Whitlow Jeanne L | -- | -- | |
| Whitlow Robert T | $115,000 | Placer Title Company |
Source: Public Records
Mortgage History
| Date | Status | Borrower | Loan Amount |
|---|---|---|---|
| Open | Collins Christopher | $250,000 | |
| Previous Owner | Whitlow Robert T | $70,000 |
Source: Public Records
Tax History Compared to Growth
Tax History
| Year | Tax Paid | Tax Assessment Tax Assessment Total Assessment is a certain percentage of the fair market value that is determined by local assessors to be the total taxable value of land and additions on the property. | Land | Improvement |
|---|---|---|---|---|
| 2025 | $3,798 | $355,473 | $137,913 | $217,560 |
| 2024 | $3,798 | $348,504 | $135,209 | $213,295 |
| 2023 | $3,698 | $341,671 | $132,558 | $209,113 |
| 2022 | $3,628 | $334,972 | $129,959 | $205,013 |
| 2021 | $3,237 | $296,247 | $157,448 | $138,799 |
| 2020 | $2,863 | $262,166 | $139,335 | $122,831 |
| 2019 | $3,397 | $245,016 | $130,220 | $114,796 |
| 2018 | $2,557 | $235,593 | $125,212 | $110,381 |
| 2017 | $2,397 | $220,181 | $117,021 | $103,160 |
| 2016 | $2,152 | $203,872 | $108,353 | $95,519 |
| 2015 | $2,347 | $185,339 | $98,503 | $86,836 |
| 2014 | $1,852 | $174,848 | $92,927 | $81,921 |
Source: Public Records
Map
Nearby Homes
- 8737 El Toreador Way
- 8865 Halverson Dr
- 9333 Aizenberg Cir
- 9407 Aizenberg Cir
- 8804 On Ct
- 9011 Quail Cove Dr
- 8841 Freemark Way
- 8896 Kelsey Dr
- 9455 E Stockton Blvd
- 9146 Quail Brook Cir
- 8770 Superb Cir
- 9497 Sara St
- 8966 Ivanpah Ct
- 9040 Elk Grove Florin Rd
- 8930 2nd Ave
- 9219 Crowell Dr
- 8904 Hyperia Ct
- 9344 Crowell Dr
- 9315 Carney Ct
- 9430 2nd Ave
- 9271 Los Torres Dr
- 8724 El Toreador Way
- 8701 Los Banos Way
- 8728 El Toreador Way
- 9275 Los Torres Dr
- 9270 Los Torres Dr
- 9266 Los Torres Dr
- 8700 Los Banos Way
- 8705 Sangria Ct
- 8732 El Toreador Way
- 8703 Los Banos Way
- 9279 Los Torres Dr
- 9276 Los Torres Dr
- 8701 Sangria Ct
- 8704 Los Banos Way
- 8669 Wren Cir
- 8736 El Toreador Way
- 8659 Hummingbird Way
- 8707 Los Banos Way
- 9280 Los Torres Dr