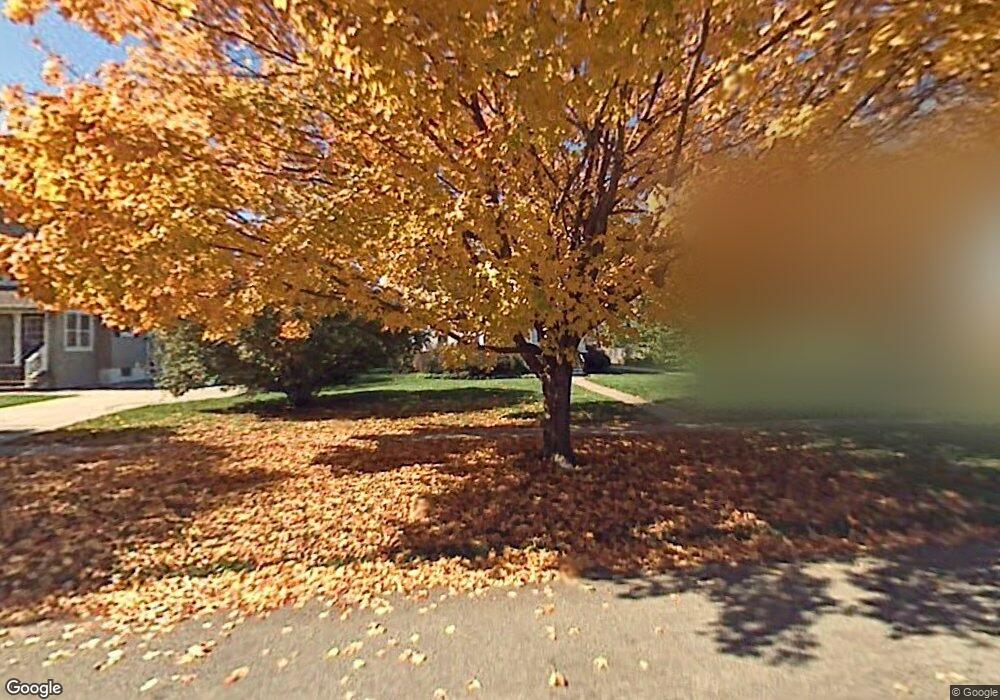
927 Elm St Grinnell, IA 50112
Estimated Value: $253,000 - $281,000
3
Beds
3
Baths
2,126
Sq Ft
$125/Sq Ft
Est. Value
About This Home
This home is located at 927 Elm St, Grinnell, IA 50112 and is currently estimated at $265,301, approximately $124 per square foot. 927 Elm St is a home located in Poweshiek County with nearby schools including Grinnell Community Senior High School and Central Iowa Christian School.
Ownership History
Date
Name
Owned For
Owner Type
Purchase Details
Closed on
Jul 19, 2022
Sold by
Perri Jean M
Bought by
Gekeler Neal M and Snow Mallory N
Current Estimated Value
Home Financials for this Owner
Home Financials are based on the most recent Mortgage that was taken out on this home.
Original Mortgage
$192,000
Outstanding Balance
$181,261
Interest Rate
4.25%
Mortgage Type
New Conventional
Estimated Equity
$84,040
Create a Home Valuation Report for This Property
The Home Valuation Report is an in-depth analysis detailing your home's value as well as a comparison with similar homes in the area
Home Values in the Area
Average Home Value in this Area
Purchase History
| Date | Buyer | Sale Price | Title Company |
|---|---|---|---|
| Gekeler Neal M | $240,000 | None Listed On Document |
Source: Public Records
Mortgage History
| Date | Status | Borrower | Loan Amount |
|---|---|---|---|
| Open | Gekeler Neal M | $192,000 |
Source: Public Records
Tax History
| Year | Tax Paid | Tax Assessment Tax Assessment Total Assessment is a certain percentage of the fair market value that is determined by local assessors to be the total taxable value of land and additions on the property. | Land | Improvement |
|---|---|---|---|---|
| 2025 | $3,714 | $259,560 | $31,500 | $228,060 |
| 2024 | $3,668 | $241,840 | $25,590 | $216,250 |
| 2023 | $3,224 | $241,840 | $25,590 | $216,250 |
| 2022 | $3,194 | $179,340 | $20,870 | $158,470 |
| 2021 | $3,194 | $169,190 | $19,690 | $149,500 |
| 2020 | $2,706 | $147,880 | $19,690 | $128,190 |
| 2019 | $2,750 | $147,880 | $19,690 | $128,190 |
| 2018 | $2,700 | $147,880 | $19,690 | $128,190 |
| 2017 | $2,762 | $147,880 | $19,690 | $128,190 |
| 2016 | $2,680 | $147,880 | $19,690 | $128,190 |
| 2015 | $2,680 | $144,470 | $19,390 | $125,080 |
| 2014 | $2,680 | $144,470 | $19,390 | $125,080 |
Source: Public Records
Map
Nearby Homes
Your Personal Tour Guide
Ask me questions while you tour the home.