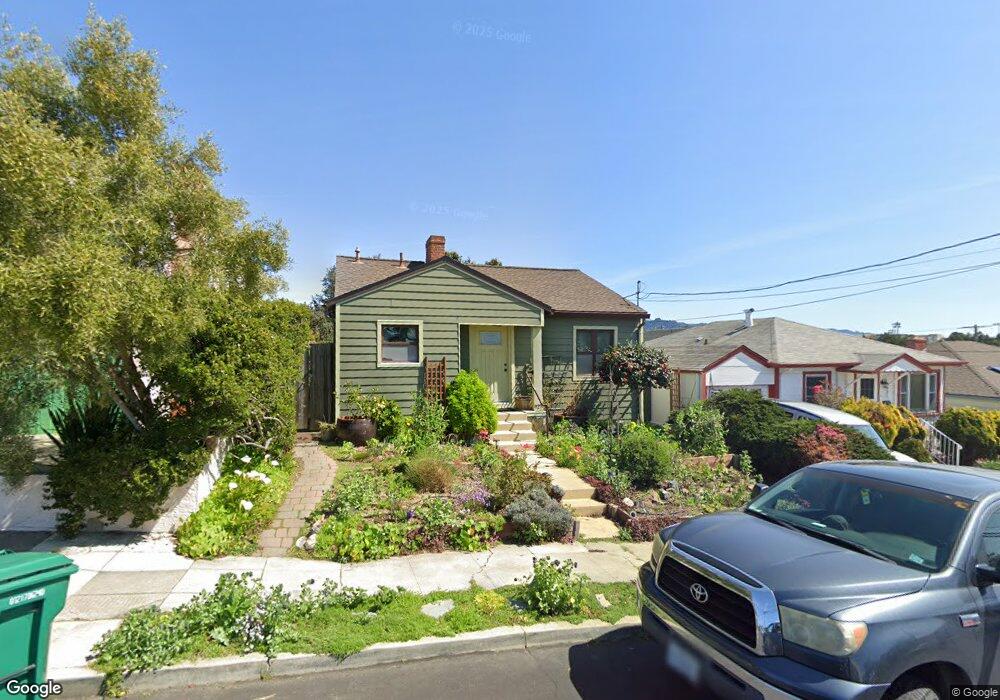
927 Fillmore St Albany, CA 94706
Solano Hill NeighborhoodEstimated Value: $906,000 - $1,153,000
2
Beds
1
Bath
811
Sq Ft
$1,216/Sq Ft
Est. Value
About This Home
This home is located at 927 Fillmore St, Albany, CA 94706 and is currently estimated at $985,988, approximately $1,215 per square foot. 927 Fillmore St is a home located in Alameda County with nearby schools including Albany Middle School, Albany High School, and Tilden Preparatory School - Albany.
Ownership History
Date
Name
Owned For
Owner Type
Purchase Details
Closed on
Apr 19, 2016
Sold by
Wong Kit M and Quan Brenda M
Bought by
The Kit Ming Wong & Brenda Quan Living T
Current Estimated Value
Home Financials for this Owner
Home Financials are based on the most recent Mortgage that was taken out on this home.
Original Mortgage
$486,500
Outstanding Balance
$400,875
Interest Rate
4.87%
Mortgage Type
Adjustable Rate Mortgage/ARM
Estimated Equity
$585,113
Purchase Details
Closed on
Sep 12, 2015
Sold by
Wong Kit M and Quan Brenda M
Bought by
The Kit Ming Wong & Brenda Quan Living T
Purchase Details
Closed on
May 17, 2010
Sold by
Byrne Leslie and The Olaf Jenkins Intervivos Tr
Bought by
Wong Kit Ming and Quan Brenda M
Home Financials for this Owner
Home Financials are based on the most recent Mortgage that was taken out on this home.
Original Mortgage
$271,500
Interest Rate
5.21%
Mortgage Type
New Conventional
Create a Home Valuation Report for This Property
The Home Valuation Report is an in-depth analysis detailing your home's value as well as a comparison with similar homes in the area
Home Values in the Area
Average Home Value in this Area
Purchase History
| Date | Buyer | Sale Price | Title Company |
|---|---|---|---|
| The Kit Ming Wong & Brenda Quan Living T | -- | Old Republic Title Co Berkel | |
| Wong Kit M | -- | Old Republic Title Co Berkel | |
| The Kit Ming Wong & Brenda Quan Living T | -- | None Available | |
| Wong Kit Ming | $362,000 | Old Republic Title Company |
Source: Public Records
Mortgage History
| Date | Status | Borrower | Loan Amount |
|---|---|---|---|
| Open | Wong Kit M | $486,500 | |
| Closed | Wong Kit Ming | $271,500 |
Source: Public Records
Tax History Compared to Growth
Tax History
| Year | Tax Paid | Tax Assessment Tax Assessment Total Assessment is a certain percentage of the fair market value that is determined by local assessors to be the total taxable value of land and additions on the property. | Land | Improvement |
|---|---|---|---|---|
| 2025 | $9,122 | $467,243 | $141,980 | $325,263 |
| 2024 | $9,122 | $458,085 | $139,197 | $318,888 |
| 2023 | $9,040 | $449,104 | $136,468 | $312,636 |
| 2022 | $8,659 | $440,300 | $133,793 | $306,507 |
| 2021 | $8,526 | $431,669 | $131,170 | $300,499 |
| 2020 | $8,376 | $427,246 | $129,826 | $297,420 |
| 2019 | $8,189 | $418,870 | $127,281 | $291,589 |
| 2018 | $7,965 | $410,659 | $124,786 | $285,873 |
| 2017 | $7,767 | $402,608 | $122,339 | $280,269 |
| 2016 | $7,404 | $394,716 | $119,941 | $274,775 |
| 2015 | $6,960 | $388,791 | $118,141 | $270,650 |
| 2014 | $6,854 | $381,177 | $115,827 | $265,350 |
Source: Public Records
Map
Nearby Homes
- 835 Solano Ave
- 715 Buchanan St
- 812 Washington Ave
- 785 Taft Ave Unit 10
- 935 Hillside Ave
- 704 Madison St
- 848 Stannage Ave Unit 11
- 555 Pierce St Unit 733D
- 555 Pierce St Unit 1534
- 555 Pierce St Unit 203
- 1013 Stannage Ave
- 545 Pierce St Unit 1206
- 1038 Cornell Ave
- 1120 Garfield Ave
- 518 Kains Ave Unit 103
- 1213 San Pablo Ave
- 840 Key Route Blvd
- 535 Pierce St Unit 3114
- 931 Fillmore St
- 925 Fillmore St
- 935 Fillmore St
- 921 Fillmore St
- 926 Taylor St
- 932 Taylor St
- 924 Taylor St
- 934 Taylor St
- 919 Fillmore St
- 937 Fillmore St
- 922 Taylor St
- 930 Fillmore St
- 926 Fillmore St
- 934 Fillmore St
- 946 Taylor St
- 920 Fillmore St
- 918 Taylor St
- 915 Fillmore St
- 805 Buchanan St
- 807 Buchanan St