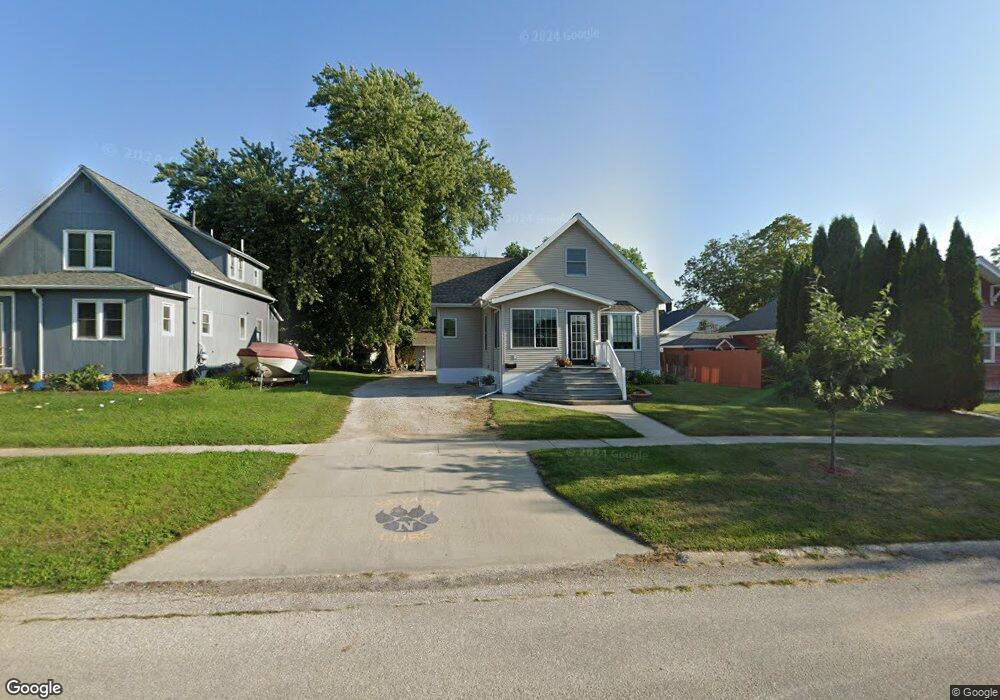
927 J Ave Nevada, IA 50201
Estimated Value: $204,000 - $236,000
3
Beds
2
Baths
1,580
Sq Ft
$142/Sq Ft
Est. Value
About This Home
This home is located at 927 J Ave, Nevada, IA 50201 and is currently estimated at $223,722, approximately $141 per square foot. 927 J Ave is a home located in Story County with nearby schools including Central Elementary School, Nevada Middle School, and Nevada High School.
Ownership History
Date
Name
Owned For
Owner Type
Purchase Details
Closed on
Oct 21, 2008
Sold by
Federal Home Loan Mortgage Corporation
Bought by
Grimm Jason and Grimm Heidi
Current Estimated Value
Home Financials for this Owner
Home Financials are based on the most recent Mortgage that was taken out on this home.
Original Mortgage
$95,736
Outstanding Balance
$62,177
Interest Rate
5.95%
Mortgage Type
FHA
Estimated Equity
$161,545
Create a Home Valuation Report for This Property
The Home Valuation Report is an in-depth analysis detailing your home's value as well as a comparison with similar homes in the area
Home Values in the Area
Average Home Value in this Area
Purchase History
| Date | Buyer | Sale Price | Title Company |
|---|---|---|---|
| Grimm Jason | $97,000 | -- |
Source: Public Records
Mortgage History
| Date | Status | Borrower | Loan Amount |
|---|---|---|---|
| Open | Grimm Jason | $95,736 |
Source: Public Records
Tax History
| Year | Tax Paid | Tax Assessment Tax Assessment Total Assessment is a certain percentage of the fair market value that is determined by local assessors to be the total taxable value of land and additions on the property. | Land | Improvement |
|---|---|---|---|---|
| 2025 | $3,584 | $222,800 | $39,000 | $183,800 |
| 2024 | $3,496 | $216,000 | $39,000 | $177,000 |
| 2023 | $3,502 | $216,000 | $39,000 | $177,000 |
| 2022 | $3,470 | $178,000 | $39,000 | $139,000 |
| 2021 | $3,496 | $178,000 | $39,000 | $139,000 |
| 2020 | $3,396 | $169,200 | $37,500 | $131,700 |
| 2019 | $3,396 | $169,200 | $37,500 | $131,700 |
| 2018 | $3,396 | $158,100 | $37,500 | $120,600 |
| 2017 | $3,396 | $158,100 | $37,500 | $120,600 |
| 2016 | $3,142 | $146,800 | $30,000 | $116,800 |
| 2015 | $3,142 | $146,800 | $30,000 | $116,800 |
| 2014 | $3,020 | $139,000 | $30,000 | $109,000 |
Source: Public Records
Map
Nearby Homes
Your Personal Tour Guide
Ask me questions while you tour the home.