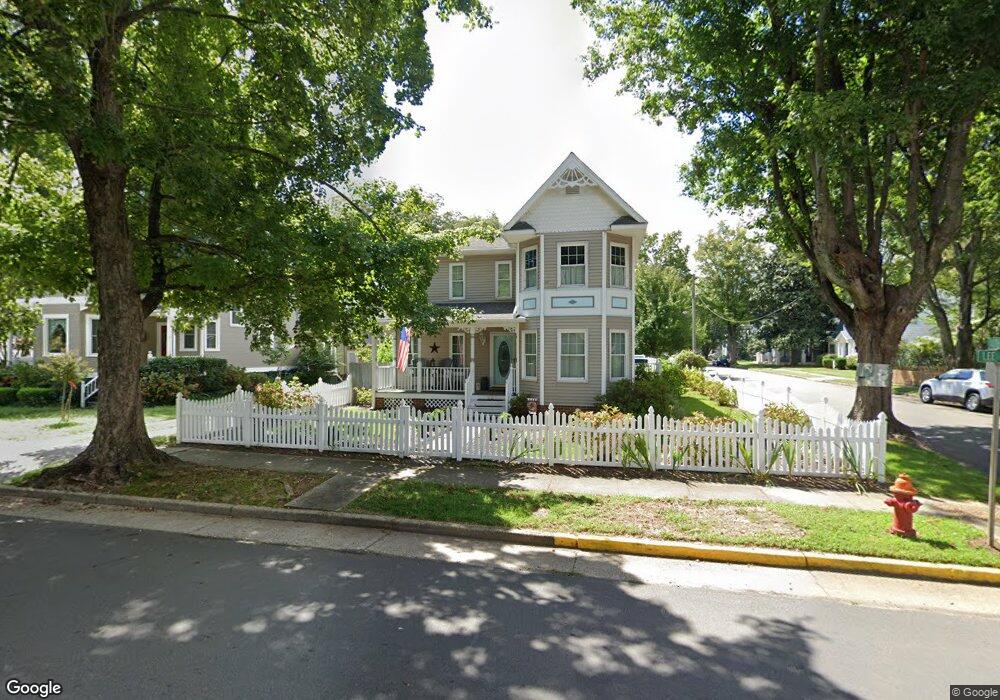
927 Lee St West Point, VA 23181
Estimated Value: $371,362 - $492,000
3
Beds
2
Baths
2,058
Sq Ft
$205/Sq Ft
Est. Value
About This Home
This home is located at 927 Lee St, West Point, VA 23181 and is currently estimated at $421,841, approximately $204 per square foot. 927 Lee St is a home located in King William County with nearby schools including West Point Elementary School, West Point Middle School, and West Point High School.
Ownership History
Date
Name
Owned For
Owner Type
Purchase Details
Closed on
Oct 18, 2021
Sold by
Blaska Virginia K and Blaska George W
Bought by
Adams Daniel Austin and Adams Ashley Selden
Current Estimated Value
Home Financials for this Owner
Home Financials are based on the most recent Mortgage that was taken out on this home.
Original Mortgage
$319,113
Outstanding Balance
$269,827
Interest Rate
2.8%
Mortgage Type
FHA
Estimated Equity
$152,014
Create a Home Valuation Report for This Property
The Home Valuation Report is an in-depth analysis detailing your home's value as well as a comparison with similar homes in the area
Home Values in the Area
Average Home Value in this Area
Purchase History
| Date | Buyer | Sale Price | Title Company |
|---|---|---|---|
| Adams Daniel Austin | $325,000 | Dhi Title Agency |
Source: Public Records
Mortgage History
| Date | Status | Borrower | Loan Amount |
|---|---|---|---|
| Open | Adams Daniel Austin | $319,113 |
Source: Public Records
Tax History
| Year | Tax Paid | Tax Assessment Tax Assessment Total Assessment is a certain percentage of the fair market value that is determined by local assessors to be the total taxable value of land and additions on the property. | Land | Improvement |
|---|---|---|---|---|
| 2025 | $919 | $301,300 | $30,000 | $271,300 |
| 2024 | $814 | $301,300 | $30,000 | $271,300 |
| 2023 | $814 | $301,300 | $30,000 | $271,300 |
| 2022 | $611 | $163,000 | $30,000 | $133,000 |
| 2021 | $619 | $163,000 | $30,000 | $133,000 |
| 2020 | $619 | $205,600 | $27,000 | $178,600 |
| 2019 | $619 | $156,800 | $30,000 | $126,800 |
| 2018 | $636 | $163,000 | $30,000 | $133,000 |
| 2017 | $660 | $163,000 | $30,000 | $133,000 |
| 2016 | $668 | $163,000 | $30,000 | $133,000 |
| 2015 | $701 | $163,000 | $30,000 | $133,000 |
| 2014 | $723 | $0 | $0 | $0 |
Source: Public Records
Map
Nearby Homes
Your Personal Tour Guide
Ask me questions while you tour the home.