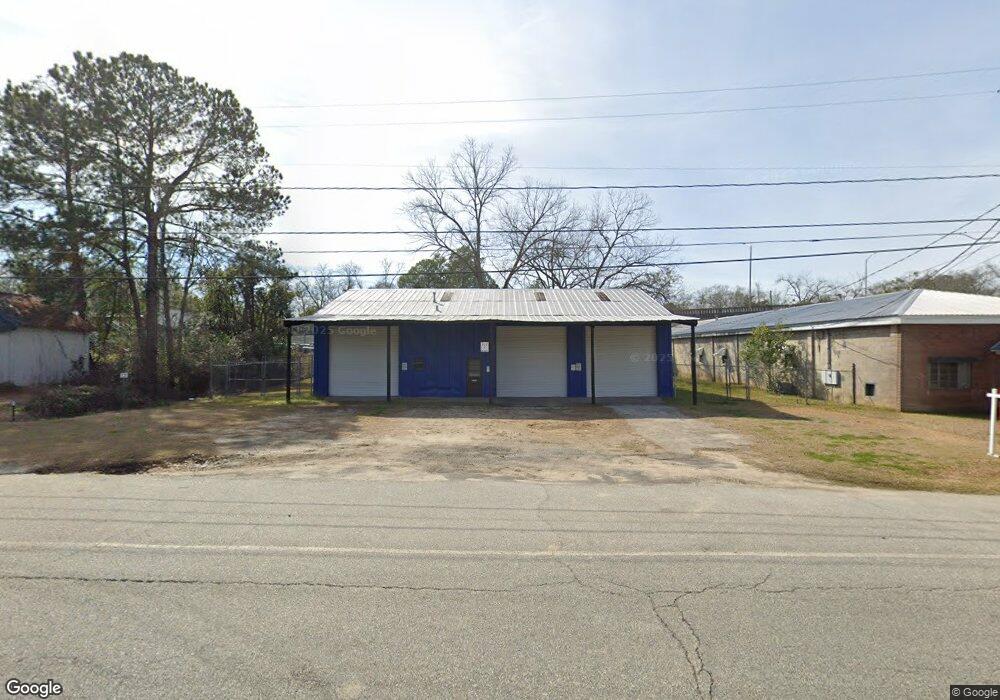
927 N Broad St Thomasville, GA 31792
Estimated Value: $73,347
--
Bed
--
Bath
2,700
Sq Ft
$27/Sq Ft
Est. Value
About This Home
This home is located at 927 N Broad St, Thomasville, GA 31792 and is currently estimated at $73,347, approximately $27 per square foot. 927 N Broad St is a home located in Thomas County with nearby schools including Thomasville High School, Thomasville Christian School, and World of Truth Christian Academy.
Ownership History
Date
Name
Owned For
Owner Type
Purchase Details
Closed on
Aug 5, 2025
Sold by
Revels Wallace
Bought by
Snipes Randall G
Current Estimated Value
Purchase Details
Closed on
Jan 31, 2006
Sold by
Thomas County Federal Savi
Bought by
Wallace Revels
Home Financials for this Owner
Home Financials are based on the most recent Mortgage that was taken out on this home.
Original Mortgage
$39,127
Interest Rate
6.14%
Purchase Details
Closed on
Jan 3, 2006
Sold by
Fam Homes Bldg
Bought by
Thomas County Federal Savings
Home Financials for this Owner
Home Financials are based on the most recent Mortgage that was taken out on this home.
Original Mortgage
$39,127
Interest Rate
6.14%
Purchase Details
Closed on
Mar 21, 2000
Sold by
Family Homes Buildin
Bought by
Revels Wallace
Purchase Details
Closed on
Feb 18, 2000
Sold by
Daw Inc
Bought by
Family Homes Buildin
Purchase Details
Closed on
Dec 7, 1999
Sold by
Holton Robert C
Bought by
Daw Inc
Purchase Details
Closed on
Aug 5, 1991
Bought by
Holton Robert C
Create a Home Valuation Report for This Property
The Home Valuation Report is an in-depth analysis detailing your home's value as well as a comparison with similar homes in the area
Home Values in the Area
Average Home Value in this Area
Purchase History
| Date | Buyer | Sale Price | Title Company |
|---|---|---|---|
| Snipes Randall G | $82,500 | -- | |
| Wallace Revels | $38,000 | -- | |
| Thomas County Federal Savings | -- | -- | |
| Revels Wallace | $48,500 | -- | |
| Family Homes Buildin | $7,500 | -- | |
| Daw Inc | -- | -- | |
| Holton Robert C | $37,400 | -- |
Source: Public Records
Mortgage History
| Date | Status | Borrower | Loan Amount |
|---|---|---|---|
| Previous Owner | Wallace Revels | $39,127 |
Source: Public Records
Tax History Compared to Growth
Tax History
| Year | Tax Paid | Tax Assessment Tax Assessment Total Assessment is a certain percentage of the fair market value that is determined by local assessors to be the total taxable value of land and additions on the property. | Land | Improvement |
|---|---|---|---|---|
| 2024 | $387 | $16,059 | $6,796 | $9,263 |
| 2023 | $360 | $14,571 | $6,796 | $7,775 |
| 2022 | $127 | $13,541 | $6,796 | $6,745 |
| 2021 | $137 | $13,266 | $6,796 | $6,470 |
| 2020 | $137 | $12,958 | $6,796 | $6,162 |
| 2019 | $138 | $12,958 | $6,796 | $6,162 |
| 2018 | $139 | $12,958 | $6,796 | $6,162 |
| 2017 | $142 | $12,958 | $6,796 | $6,162 |
| 2016 | $179 | $16,344 | $6,796 | $9,548 |
| 2015 | $181 | $16,344 | $6,796 | $9,548 |
| 2014 | $166 | $14,795 | $6,796 | $8,000 |
| 2013 | -- | $14,795 | $6,795 | $7,999 |
Source: Public Records
Map
Nearby Homes
- 119 E Merrill St
- 822 N Stevens St
- 113 Crystal St
- 1511 N Dawson St
- 417 W West Walcott St
- 1225 N Stevens St
- 1101 N Crawford St
- 526 N Crawford St
- 111 Meadow St
- 515 Pine St
- 205 Cloverdale Dr
- 104 Dixon St
- 415 N Crawford St
- 1307 N Dawson St
- 0.73ACR Edgewood Circle (Parcel 003 014015)
- 1102 N Young St
- 207 Mckinley St
- 701 E Calhoun St
- 707 E Calhoun St
- 313 Felix St
- 909 N Broad St
- 906 N Madison St
- 102 W Merrill St
- 928 N Broad St
- 912 N Broad St
- 902 SE Madison Alley
- 902 E Madison Alley
- 902 N Madison St
- 913 Madison Alley SW
- 910 N Broad St
- 900&910 N Broad St
- 911 N Madison St
- 203 W Merrill St
- 1001 N Madison St
- 110 E Merrill St
- 900 N Broad St
- 1003 N Madison St
- 112 E Merrill St
- 7 Brooks Ln
- 207 W Merrill St