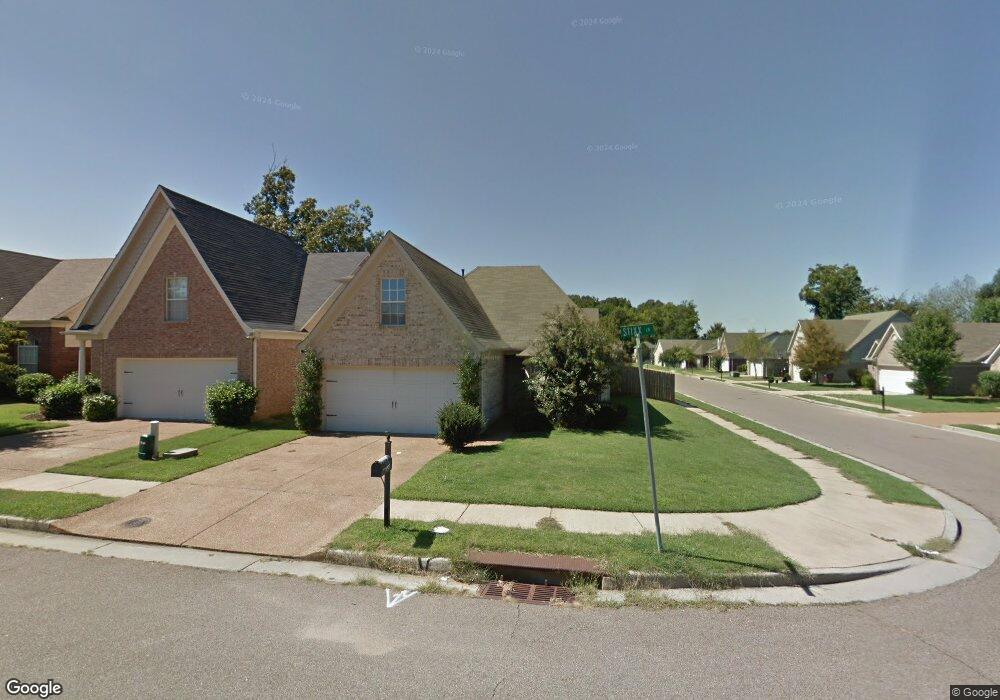
927 Stixx Ln Cordova, TN 38018
Cordova NeighborhoodEstimated Value: $232,000 - $260,000
4
Beds
3
Baths
2,090
Sq Ft
$118/Sq Ft
Est. Value
About This Home
This home is located at 927 Stixx Ln, Cordova, TN 38018 and is currently estimated at $247,637, approximately $118 per square foot. 927 Stixx Ln is a home located in Shelby County with nearby schools including Dexter Elementary School, Dexter Middle School, and Cordova High School.
Ownership History
Date
Name
Owned For
Owner Type
Purchase Details
Closed on
Apr 10, 2018
Sold by
Mitchell Raphael
Bought by
Sim John H
Current Estimated Value
Home Financials for this Owner
Home Financials are based on the most recent Mortgage that was taken out on this home.
Original Mortgage
$126,000
Outstanding Balance
$108,358
Interest Rate
4.44%
Mortgage Type
New Conventional
Estimated Equity
$139,279
Purchase Details
Closed on
May 16, 2011
Sold by
Riley Eric and Riley Shari
Bought by
Mitchell Raphael
Purchase Details
Closed on
Dec 14, 2005
Sold by
Compass Pointe Homes Llc
Bought by
Riley Eric and Riley Shari
Home Financials for this Owner
Home Financials are based on the most recent Mortgage that was taken out on this home.
Original Mortgage
$119,160
Interest Rate
7.15%
Mortgage Type
Fannie Mae Freddie Mac
Create a Home Valuation Report for This Property
The Home Valuation Report is an in-depth analysis detailing your home's value as well as a comparison with similar homes in the area
Home Values in the Area
Average Home Value in this Area
Purchase History
| Date | Buyer | Sale Price | Title Company |
|---|---|---|---|
| Sim John H | $157,500 | None Available | |
| Mitchell Raphael | $93,001 | None Available | |
| Riley Eric | $148,950 | Tam Title & Escrow Llc |
Source: Public Records
Mortgage History
| Date | Status | Borrower | Loan Amount |
|---|---|---|---|
| Open | Sim John H | $126,000 | |
| Previous Owner | Riley Eric | $119,160 |
Source: Public Records
Tax History Compared to Growth
Tax History
| Year | Tax Paid | Tax Assessment Tax Assessment Total Assessment is a certain percentage of the fair market value that is determined by local assessors to be the total taxable value of land and additions on the property. | Land | Improvement |
|---|---|---|---|---|
| 2025 | $1,581 | $69,975 | $10,650 | $59,325 |
| 2024 | $1,581 | $46,625 | $8,775 | $37,850 |
| 2023 | $1,581 | $46,625 | $8,775 | $37,850 |
| 2022 | $1,581 | $46,625 | $8,775 | $37,850 |
| 2021 | $1,609 | $46,625 | $8,775 | $37,850 |
| 2020 | $1,506 | $37,175 | $8,775 | $28,400 |
| 2019 | $1,506 | $37,175 | $8,775 | $28,400 |
| 2018 | $1,506 | $37,175 | $8,775 | $28,400 |
| 2017 | $1,528 | $37,175 | $8,775 | $28,400 |
| 2016 | $1,510 | $34,550 | $0 | $0 |
| 2014 | $1,510 | $34,550 | $0 | $0 |
Source: Public Records
Map
Nearby Homes
- 7247 Winterbrook Ln
- 7303 Winterbrook Ln
- 7194 Charlton Way
- 7420 Dal Whinnie Trail
- 6890 Century Oaks Dr
- 887 Dalemore Ln
- 6884 Wrigley Dr
- 6880 Wrigley Dr
- 7486 Dal Whinnie Trail
- 1089 Links View Ln W
- 7468 Links View Ln S
- 7494 Links View Ln S
- 1382 Exbury Dr
- 6840 Kamali Ave
- 7565 Wintergreen Ln
- 6774 Whitten Pine Dr
- 1102 Mirror Lake Ln
- 1277 Winter Springs Ln
- 7035 S Estacada Way
- 956 Spinnaker Ln
- 923 Stixx Ln
- 919 Stixx Ln
- 932 Divi Ln
- 926 Divi Ln
- 7146 Grapetree Trail
- 7140 Grapetree Trail
- 915 Stixx Ln
- 7152 Grapetree Trail
- 922 Divi Ln
- 7134 Grapetree Trail
- 930 Stixx Ln
- 926 Stixx Ln
- 922 Stixx Ln
- 918 Divi Ln
- 7158 Grapetree Trail
- 7128 Grapetree Trail
- 911 Stixx Ln
- 918 Stixx Ln
- 914 Divi Ln
- 914 Stixx Ln