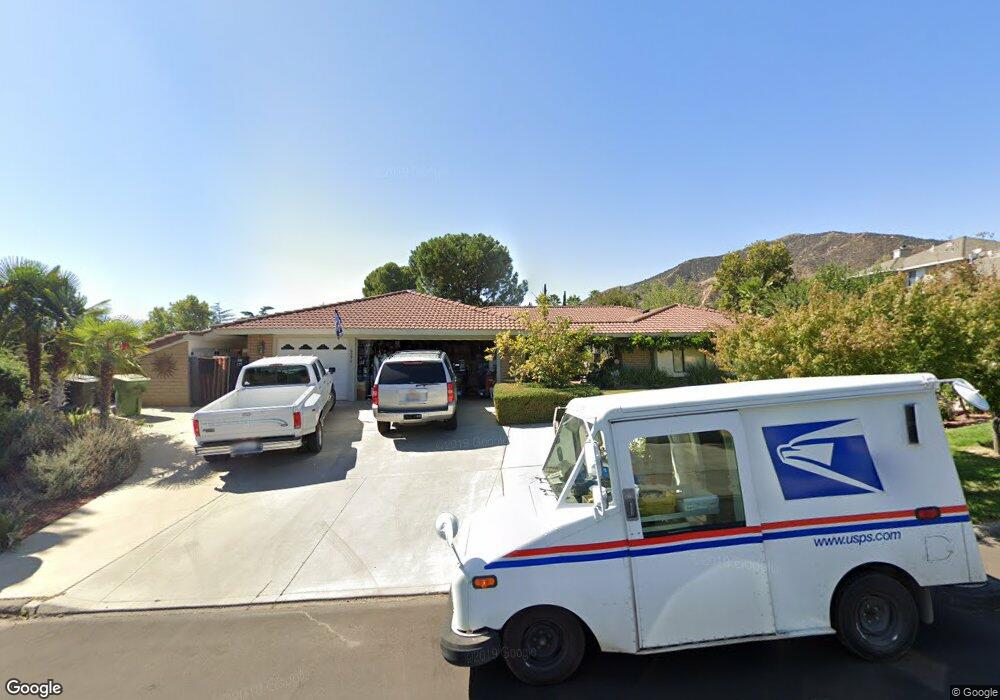
9279 Beauview Dr Cherry Valley, CA 92223
Estimated Value: $627,000 - $831,000
4
Beds
6
Baths
2,337
Sq Ft
$322/Sq Ft
Est. Value
About This Home
This home is located at 9279 Beauview Dr, Cherry Valley, CA 92223 and is currently estimated at $752,600, approximately $322 per square foot. 9279 Beauview Dr is a home located in Riverside County with nearby schools including Brookside Elementary School, Mountain View Middle School, and Beaumont Senior High School.
Ownership History
Date
Name
Owned For
Owner Type
Purchase Details
Closed on
May 29, 2003
Sold by
Cunningham Kenneth D and Cunningham Diane Marie
Bought by
Cunningham Kenneth D and Cunningham Diane Marie
Current Estimated Value
Purchase Details
Closed on
Feb 13, 1996
Sold by
Griner Kenneth E and Griner Jacqueline J
Bought by
Walls Henry E and Cunningham Natalie M
Home Financials for this Owner
Home Financials are based on the most recent Mortgage that was taken out on this home.
Original Mortgage
$49,500
Outstanding Balance
$1,634
Interest Rate
7.1%
Mortgage Type
Seller Take Back
Estimated Equity
$750,966
Purchase Details
Closed on
Sep 27, 1995
Sold by
Cunningham Kenneth D
Bought by
Cunningham Diane M
Home Financials for this Owner
Home Financials are based on the most recent Mortgage that was taken out on this home.
Original Mortgage
$96,000
Interest Rate
7.12%
Create a Home Valuation Report for This Property
The Home Valuation Report is an in-depth analysis detailing your home's value as well as a comparison with similar homes in the area
Home Values in the Area
Average Home Value in this Area
Purchase History
| Date | Buyer | Sale Price | Title Company |
|---|---|---|---|
| Cunningham Kenneth D | -- | -- | |
| Walls Henry E | $55,000 | Stewart Title Company | |
| Cunningham Diane M | -- | Fidelity Title |
Source: Public Records
Mortgage History
| Date | Status | Borrower | Loan Amount |
|---|---|---|---|
| Open | Walls Henry E | $49,500 | |
| Previous Owner | Cunningham Diane M | $96,000 |
Source: Public Records
Tax History Compared to Growth
Tax History
| Year | Tax Paid | Tax Assessment Tax Assessment Total Assessment is a certain percentage of the fair market value that is determined by local assessors to be the total taxable value of land and additions on the property. | Land | Improvement |
|---|---|---|---|---|
| 2025 | $3,978 | $314,907 | $82,839 | $232,068 |
| 2023 | $3,978 | $302,680 | $79,623 | $223,057 |
| 2022 | $3,914 | $296,746 | $78,062 | $218,684 |
| 2021 | $3,837 | $290,929 | $76,532 | $214,397 |
| 2020 | $3,797 | $287,947 | $75,748 | $212,199 |
| 2019 | $3,736 | $282,302 | $74,263 | $208,039 |
| 2018 | $3,720 | $276,767 | $72,808 | $203,959 |
| 2017 | $3,660 | $271,341 | $71,381 | $199,960 |
| 2016 | $3,562 | $266,022 | $69,982 | $196,040 |
| 2015 | $3,501 | $262,029 | $68,932 | $193,097 |
| 2014 | $3,502 | $256,898 | $67,583 | $189,315 |
Source: Public Records
Map
Nearby Homes
- 9103 Oak Creek Rd
- 9232 Bonita Dr
- 39380 Oak View Ln
- 39581 Cherry Oak Canyon Rd
- 9575 Oak Glen Rd
- 9187 Bonita Dr
- 0 Tokay St Unit EV22011453
- 39407 Tokay St
- 9643 Avenida Miravilla
- 0 Cherry Valley Unit EV24091167
- 0 Avenida Miravilla
- 9643 Avenue San Timoteo
- 10007 Beaumont Ave
- 38570 Pass View Dr
- 1 Avenida Miravilla
- 0 Lofty Ln Unit EV24172601
- 8321 Overview Ct
- 0 Meadow View Ln Unit IG25256661
- 8705 Apple Tree Ln
- 9870 Nancy Ave
- 9245 Beauview Dr
- 9315 Beauview Dr
- 9280 Beauview Dr
- 9250 Beauview Dr
- 9320 Beauview Dr
- 35492 Cherry Tree Rd
- 9335 Beauview Dr
- 39290 Cherry Tree Rd
- 39335 Cherry Tree Rd
- 9285 Rancho Dr
- 39300 Cherry Tree Rd
- 9311 Oak Creek Rd
- 9361 Beauview Dr
- 9181 Beauview Dr
- 9279 Oak Creek Rd
- 9243 Rancho Dr
- 9331 Oak Creek Rd
- 9323 Rancho Dr
- 39330 Cherry Tree Rd
- 9249 Oak Creek Rd