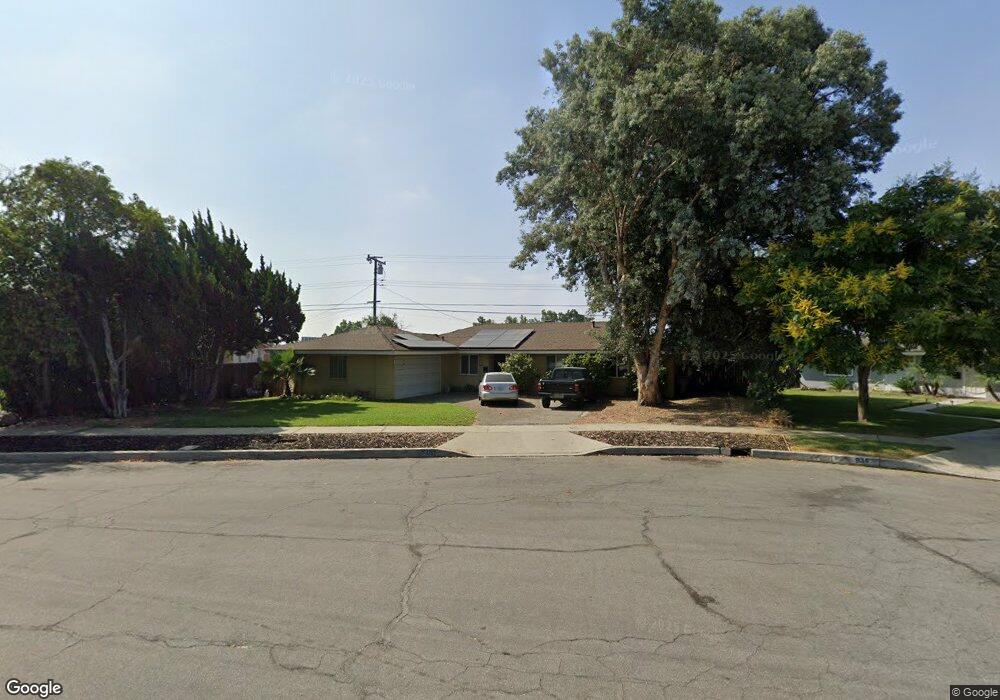
928 Azure Ct Upland, CA 91786
Estimated Value: $680,000 - $741,000
4
Beds
2
Baths
1,450
Sq Ft
$491/Sq Ft
Est. Value
About This Home
This home is located at 928 Azure Ct, Upland, CA 91786 and is currently estimated at $712,483, approximately $491 per square foot. 928 Azure Ct is a home located in San Bernardino County with nearby schools including Citrus Elementary, Upland Junior High School, and Upland High School.
Ownership History
Date
Name
Owned For
Owner Type
Purchase Details
Closed on
Jun 1, 2015
Sold by
Lunde Norma Munster
Bought by
Soto James Robert and Soto Michael James
Current Estimated Value
Home Financials for this Owner
Home Financials are based on the most recent Mortgage that was taken out on this home.
Original Mortgage
$250,000
Outstanding Balance
$194,183
Interest Rate
3.83%
Mortgage Type
New Conventional
Estimated Equity
$518,300
Purchase Details
Closed on
Sep 9, 2014
Sold by
Lunde Norma M
Bought by
Lunde Norma Munster and Norma Munster Lunde Trust
Purchase Details
Closed on
Jun 25, 1997
Sold by
Lunde Norma M
Bought by
Lunde Norma M and Lunde Trust
Purchase Details
Closed on
Apr 10, 1996
Sold by
Lunde Odin W
Bought by
Lunde Norma M
Create a Home Valuation Report for This Property
The Home Valuation Report is an in-depth analysis detailing your home's value as well as a comparison with similar homes in the area
Home Values in the Area
Average Home Value in this Area
Purchase History
| Date | Buyer | Sale Price | Title Company |
|---|---|---|---|
| Soto James Robert | $312,500 | Ticor Title Riverside | |
| Soto Michael James | -- | Ticor Title Riverside | |
| Lunde Norma Munster | -- | None Available | |
| Lunde Norma M | -- | -- | |
| Lunde Norma M | -- | -- | |
| Lunde Norma M | -- | -- | |
| Lunde Norma M | -- | -- |
Source: Public Records
Mortgage History
| Date | Status | Borrower | Loan Amount |
|---|---|---|---|
| Open | Soto James Robert | $250,000 |
Source: Public Records
Tax History
| Year | Tax Paid | Tax Assessment Tax Assessment Total Assessment is a certain percentage of the fair market value that is determined by local assessors to be the total taxable value of land and additions on the property. | Land | Improvement |
|---|---|---|---|---|
| 2025 | $4,101 | $369,938 | $129,478 | $240,460 |
| 2024 | $3,970 | $362,684 | $126,939 | $235,745 |
| 2023 | $3,908 | $355,573 | $124,450 | $231,123 |
| 2022 | $3,822 | $348,601 | $122,010 | $226,591 |
| 2021 | $3,815 | $341,766 | $119,618 | $222,148 |
| 2020 | $3,711 | $338,261 | $118,391 | $219,870 |
| 2019 | $3,697 | $331,629 | $116,070 | $215,559 |
| 2018 | $3,607 | $325,126 | $113,794 | $211,332 |
| 2017 | $3,553 | $318,751 | $111,563 | $207,188 |
| 2016 | $3,300 | $312,500 | $109,375 | $203,125 |
| 2015 | $502 | $52,822 | $10,179 | $42,643 |
| 2014 | -- | $51,788 | $9,980 | $41,808 |
Source: Public Records
Map
Nearby Homes
- 306 S Vallejo Way
- 814 W Bonnie Brae Ct
- 1550 N Bonita Ct
- 822 W 5th St
- 428 W 8th St
- 858 W Yale St
- 340 W Caroline Ct
- 333 White Ave
- 1436 N Elderberry Ave
- 296 S Laurel Ave
- 345 Euclid Place
- 1399 Fredericks Ln
- 1446 N Gardenia Ave
- 435 W 9th St Unit B3
- 1443 Fredericks Ln
- 134 Coral Way
- 1335 N Elderberry Ave
- 1549 N Oaks Ct
- 126 Irving Way
- 1554 N Helen Ct
Your Personal Tour Guide
Ask me questions while you tour the home.