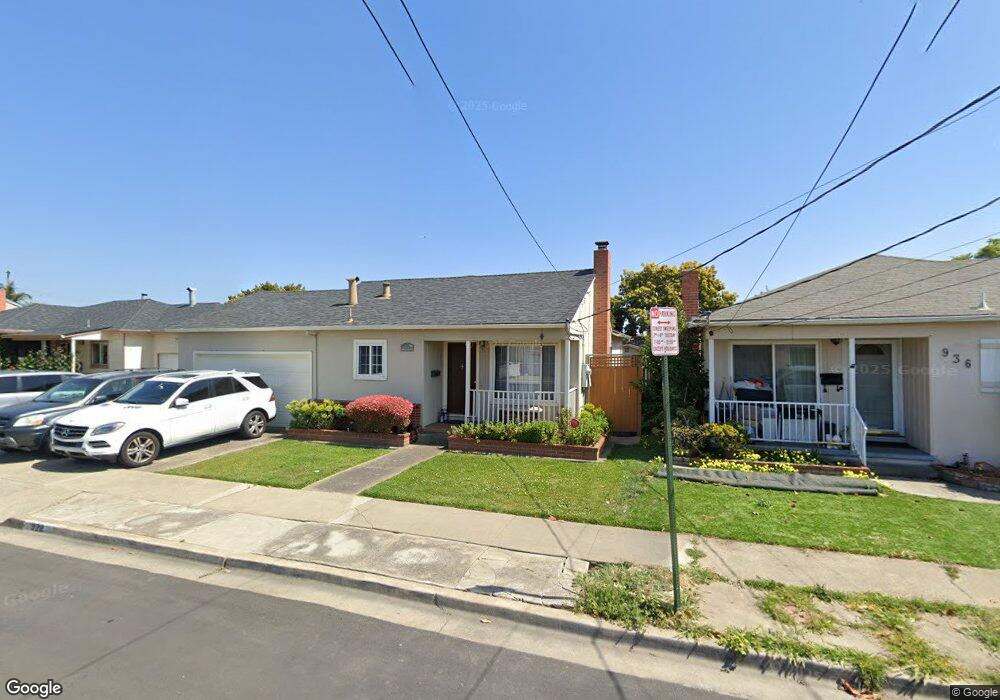
928 Chenault Way Hayward, CA 94541
Longwood- Winton Grove NeighborhoodEstimated Value: $723,000 - $931,000
3
Beds
1
Bath
1,070
Sq Ft
$735/Sq Ft
Est. Value
About This Home
This home is located at 928 Chenault Way, Hayward, CA 94541 and is currently estimated at $786,529, approximately $735 per square foot. 928 Chenault Way is a home located in Alameda County with nearby schools including Longwood Elementary School, Anthony W. Ochoa Middle School, and Mt. Eden High School.
Ownership History
Date
Name
Owned For
Owner Type
Purchase Details
Closed on
Jan 13, 2022
Sold by
Ghattas Nora A
Bought by
Ghattas Nora Ann
Current Estimated Value
Home Financials for this Owner
Home Financials are based on the most recent Mortgage that was taken out on this home.
Original Mortgage
$495,000
Outstanding Balance
$454,089
Interest Rate
3.22%
Mortgage Type
New Conventional
Estimated Equity
$332,440
Purchase Details
Closed on
Jan 8, 2020
Sold by
King David
Bought by
King Nora A
Home Financials for this Owner
Home Financials are based on the most recent Mortgage that was taken out on this home.
Original Mortgage
$504,000
Interest Rate
3.6%
Mortgage Type
New Conventional
Purchase Details
Closed on
Jul 29, 2008
Sold by
Gonzalez Carlos and Gonzalez Graciela
Bought by
Gonzalez Carlos and Gonzalez Graciela
Purchase Details
Closed on
Nov 16, 1999
Sold by
Gonzalez Carlos and Gonzalez Graciela
Bought by
King David and King Nora A
Home Financials for this Owner
Home Financials are based on the most recent Mortgage that was taken out on this home.
Original Mortgage
$188,790
Interest Rate
5.05%
Purchase Details
Closed on
Apr 22, 1997
Sold by
Stangeland Layne A and Stangeland Jill C
Bought by
Gonzalez Carlos
Home Financials for this Owner
Home Financials are based on the most recent Mortgage that was taken out on this home.
Original Mortgage
$158,600
Interest Rate
7.75%
Create a Home Valuation Report for This Property
The Home Valuation Report is an in-depth analysis detailing your home's value as well as a comparison with similar homes in the area
Home Values in the Area
Average Home Value in this Area
Purchase History
| Date | Buyer | Sale Price | Title Company |
|---|---|---|---|
| Ghattas Nora Ann | -- | Lawyers Title | |
| King Nora A | -- | Servicelink | |
| Gonzalez Carlos | -- | None Available | |
| King David | $210,000 | Commonwealth Land Title Co | |
| Gonzalez Carlos | $167,000 | Chicago Title Co |
Source: Public Records
Mortgage History
| Date | Status | Borrower | Loan Amount |
|---|---|---|---|
| Open | Ghattas Nora Ann | $495,000 | |
| Previous Owner | King Nora A | $504,000 | |
| Previous Owner | King David | $188,790 | |
| Previous Owner | Gonzalez Carlos | $158,600 |
Source: Public Records
Tax History
| Year | Tax Paid | Tax Assessment Tax Assessment Total Assessment is a certain percentage of the fair market value that is determined by local assessors to be the total taxable value of land and additions on the property. | Land | Improvement |
|---|---|---|---|---|
| 2025 | $4,125 | $322,746 | $96,824 | $225,922 |
| 2024 | $4,125 | $316,418 | $94,925 | $221,493 |
| 2023 | $4,065 | $310,215 | $93,064 | $217,151 |
| 2022 | $3,989 | $304,134 | $91,240 | $212,894 |
| 2021 | $3,957 | $298,171 | $89,451 | $208,720 |
| 2020 | $3,915 | $295,117 | $88,535 | $206,582 |
| 2019 | $3,945 | $289,331 | $86,799 | $202,532 |
| 2018 | $3,711 | $283,658 | $85,097 | $198,561 |
| 2017 | $3,630 | $278,098 | $83,429 | $194,669 |
| 2016 | $3,414 | $272,647 | $81,794 | $190,853 |
| 2015 | $3,349 | $268,551 | $80,565 | $187,986 |
| 2014 | $3,187 | $263,291 | $78,987 | $184,304 |
Source: Public Records
Map
Nearby Homes
- 1150 W Winton Ave Unit 207
- 1150 W Winton Ave Unit 204
- 1200 W Winton Ave Unit 168
- 1200 W Winton Ave Unit 119
- 1200 W Winton Ave Unit 81
- 1200 W Winton Ave Unit 90
- 1200 W Winton Ave Unit 203
- 22357 S Garden Ave
- 462 Craven Ct
- 406 Craven Ct
- 19390 Hesperian Blvd
- 1429 Poppy Ln
- 22241 S Garden Ave
- 24023 Edloe Dr
- 225 Montevina Way
- 205 Montevina Way
- 24768 Mango St
- 21371 Garden Ave
- 22575 Amador St
- 25055 Copa Del Oro Dr Unit 102
- 920 Chenault Way
- 936 Chenault Way
- 947 Phillips Way
- 912 Chenault Way
- 944 Chenault Way
- 953 Phillips Way
- 959 Phillips Way
- 929 Chenault Way
- 952 Chenault Way
- 23463 Odom Dr
- 904 Chenault Way
- 937 Chenault Way
- 921 Chenault Way
- 23502 Wright Dr
- 945 Chenault Way
- 967 Phillips Way
- 23491 Odom Dr
- 913 Chenault Way
- 960 Chenault Way
- 951 Chenault Way
Your Personal Tour Guide
Ask me questions while you tour the home.