J
Seller's Agent in 2018
Jake Stoltenberg
EXIT Realty Fireside

Estimated Value: $97,000 - $126,000
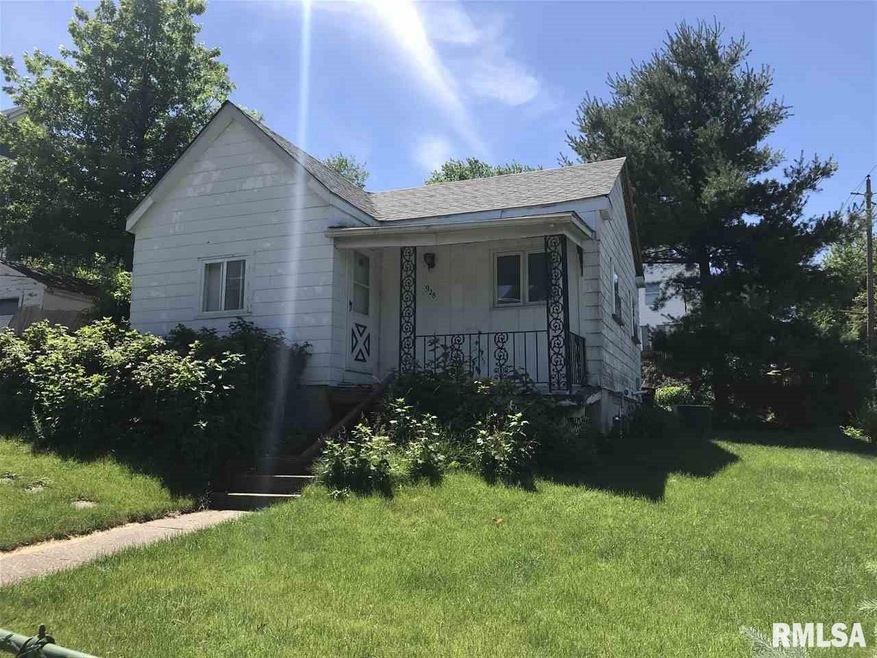
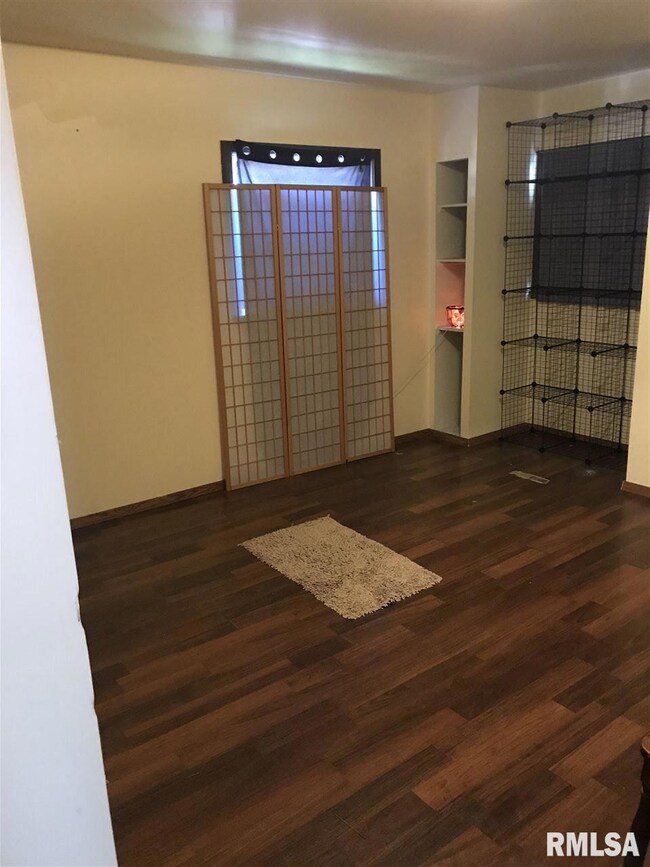
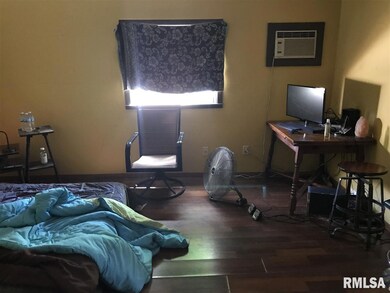
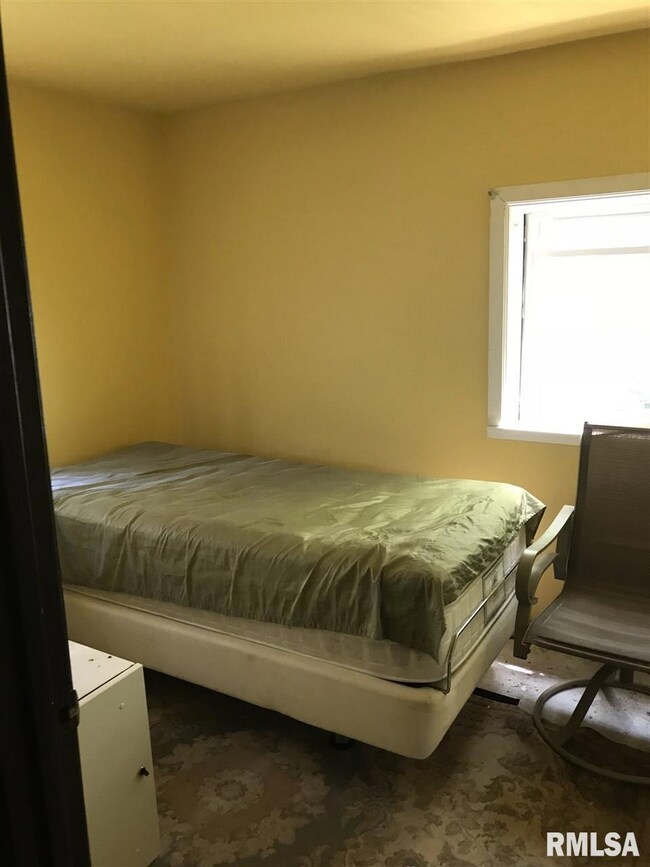
Investor Special!!! This is priced to sell and will not last long. Newer roof in 2017, newer floor throughout. Large master bedroom with 3/4 bath.
Last Agent to Sell the Property
Jake Stoltenberg
EXIT Realty Fireside License #S66085000 Listed on: 06/26/2018

Last Buyer's Agent
Jason Young
Relocation Reps, LLC License #B57655000
| Date | Buyer | Sale Price | Title Company |
|---|---|---|---|
| Quiet Capital Llc | $95,000 | -- | |
| Quiet Capital Llc | -- | -- | |
| Oberheu Thomas E | -- | None Available |
| Date | Status | Borrower | Loan Amount |
|---|---|---|---|
| Open | Quiet Capital Llc | $47,500 |
| Date | Event | Price | List to Sale | Price per Sq Ft |
|---|---|---|---|---|
| 07/23/2018 07/23/18 | Sold | $21,000 | -25.0% | $25 / Sq Ft |
| 06/28/2018 06/28/18 | Pending | -- | -- | -- |
| 06/26/2018 06/26/18 | For Sale | $28,000 | -- | $33 / Sq Ft |
| Year | Tax Paid | Tax Assessment Tax Assessment Total Assessment is a certain percentage of the fair market value that is determined by local assessors to be the total taxable value of land and additions on the property. | Land | Improvement |
|---|---|---|---|---|
| 2025 | $1,480 | $82,820 | $22,580 | $60,240 |
| 2024 | $1,698 | $82,820 | $22,580 | $60,240 |
| 2023 | $1,594 | $82,820 | $22,580 | $60,240 |
| 2022 | $1,943 | $67,240 | $10,320 | $56,920 |
| 2021 | $1,640 | $76,460 | $10,320 | $66,140 |
| 2020 | $1,485 | $67,440 | $10,320 | $57,120 |
| 2019 | $1,040 | $54,880 | $10,320 | $44,560 |
| 2018 | $962 | $54,880 | $10,320 | $44,560 |
| 2017 | $292 | $52,540 | $10,320 | $42,220 |
| 2016 | $960 | $52,540 | $0 | $0 |
| 2015 | $960 | $44,630 | $0 | $0 |
| 2014 | $798 | $44,630 | $0 | $0 |
| 2013 | $780 | $0 | $0 | $0 |
| 2012 | -- | $49,840 | $9,730 | $40,110 |
J
Seller's Agent in 2018
Jake Stoltenberg
EXIT Realty Fireside
J
Buyer's Agent in 2018
Jason Young
Relocation Reps, LLC
Source: RMLS Alliance
MLS Number: RMAQC4193844
APN: F0035-03
Disclaimer: Certain information contained herein is derived from information provided by parties other than Homes.com. All information provided is deemed reliable, but is not guaranteed to be accurate and should be independently verified.
![]() IDX information is provided exclusively for personal, non-commercial use, and may not be used for any purpose other than to identify prospective properties consumers may be interested in purchasing. Information is deemed reliable but not guaranteed.
IDX information is provided exclusively for personal, non-commercial use, and may not be used for any purpose other than to identify prospective properties consumers may be interested in purchasing. Information is deemed reliable but not guaranteed.