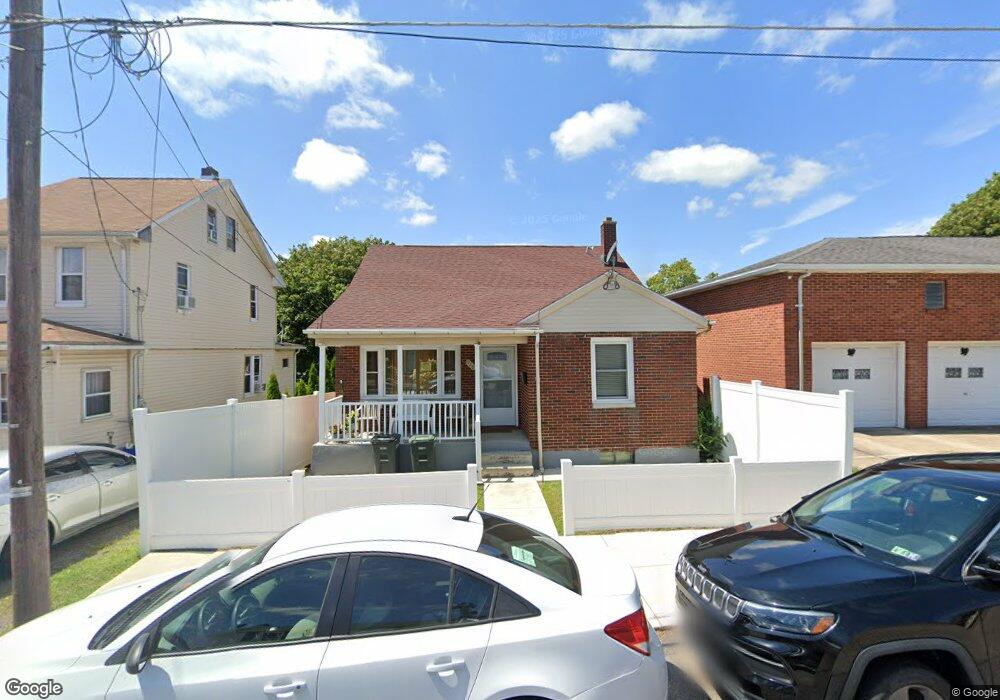
928 Grant St Hazleton, PA 18201
Estimated Value: $154,944 - $221,000
Studio
--
Bath
1,252
Sq Ft
$151/Sq Ft
Est. Value
About This Home
This home is located at 928 Grant St, Hazleton, PA 18201 and is currently estimated at $188,736, approximately $150 per square foot. 928 Grant St is a home located in Luzerne County with nearby schools including Hazleton Area High School, Immanuel Christian School, and Bishop Hafey Junior/Senior High School.
Ownership History
Date
Name
Owned For
Owner Type
Purchase Details
Closed on
Jan 27, 2017
Sold by
Vercusky Thomas M
Bought by
Williams Marlene E
Current Estimated Value
Home Financials for this Owner
Home Financials are based on the most recent Mortgage that was taken out on this home.
Original Mortgage
$75,605
Outstanding Balance
$62,772
Interest Rate
4.3%
Mortgage Type
FHA
Estimated Equity
$125,964
Purchase Details
Closed on
Jun 21, 2011
Sold by
Fannie Mae
Bought by
Vercusky Thomas M
Purchase Details
Closed on
Apr 26, 2011
Sold by
Gilligan John F
Bought by
Federal National Mortgage Association
Create a Home Valuation Report for This Property
The Home Valuation Report is an in-depth analysis detailing your home's value as well as a comparison with similar homes in the area
Home Values in the Area
Average Home Value in this Area
Purchase History
| Date | Buyer | Sale Price | Title Company |
|---|---|---|---|
| Williams Marlene E | $77,000 | None Available | |
| Vercusky Thomas M | $35,700 | None Available | |
| Federal National Mortgage Association | $1,298 | None Available |
Source: Public Records
Mortgage History
| Date | Status | Borrower | Loan Amount |
|---|---|---|---|
| Open | Williams Marlene E | $75,605 |
Source: Public Records
Tax History
| Year | Tax Paid | Tax Assessment Tax Assessment Total Assessment is a certain percentage of the fair market value that is determined by local assessors to be the total taxable value of land and additions on the property. | Land | Improvement |
|---|---|---|---|---|
| 2025 | $1,884 | $65,600 | $24,500 | $41,100 |
| 2024 | $1,765 | $65,600 | $24,500 | $41,100 |
| 2023 | $1,650 | $65,600 | $24,500 | $41,100 |
| 2022 | $1,638 | $65,600 | $24,500 | $41,100 |
| 2021 | $1,600 | $65,600 | $24,500 | $41,100 |
| 2020 | $1,430 | $65,600 | $24,500 | $41,100 |
| 2019 | $1,475 | $65,600 | $24,500 | $41,100 |
| 2018 | $1,425 | $65,600 | $24,500 | $41,100 |
| 2017 | $1,314 | $65,600 | $24,500 | $41,100 |
| 2016 | $934 | $65,600 | $24,500 | $41,100 |
| 2015 | $1,616 | $65,600 | $24,500 | $41,100 |
| 2014 | $1,616 | $65,600 | $24,500 | $41,100 |
Source: Public Records
Map
Nearby Homes
- 829 W 21st St
- 864 Alter St
- 897 N Vine St
- 714 Alter St
- 60 E Jefferson Ave
- 609 Landmesser Ave
- 0 Church Unit PALU2002778
- 608 Mckinley St
- 590 Mckinley St
- 403 W 7th St
- 837 N Laurel St
- 19 W 14th St
- 118 E Green St
- 1087 N Rear Locust St
- 1 W Diamond Ave
- 397 W 30th St
- 239 Lincalis St
- 307 W Green St
- 911 Seybert St
- 991 Seybert St