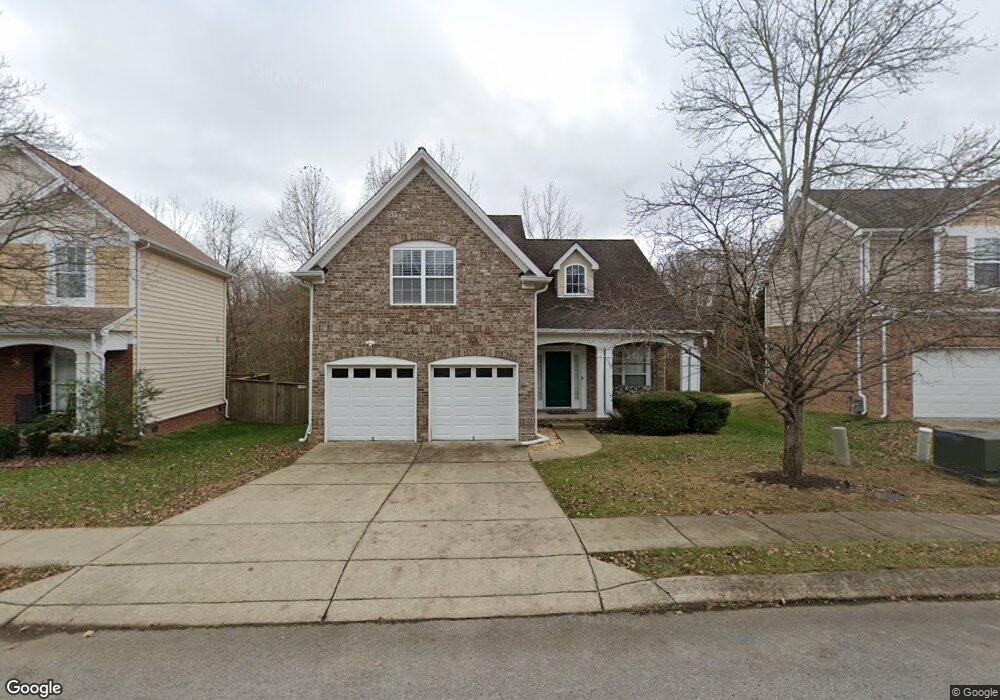
928 Legacy Park Rd Mount Juliet, TN 37122
Estimated Value: $497,202 - $526,000
--
Bed
3
Baths
2,687
Sq Ft
$189/Sq Ft
Est. Value
About This Home
This home is located at 928 Legacy Park Rd, Mount Juliet, TN 37122 and is currently estimated at $506,801, approximately $188 per square foot. 928 Legacy Park Rd is a home located in Wilson County with nearby schools including Rutland Elementary School, Gladeville Middle School, and Wilson Central High School.
Ownership History
Date
Name
Owned For
Owner Type
Purchase Details
Closed on
Feb 17, 2010
Sold by
Bowden John F
Bought by
Averbukh Lev
Current Estimated Value
Home Financials for this Owner
Home Financials are based on the most recent Mortgage that was taken out on this home.
Original Mortgage
$104,300
Outstanding Balance
$68,821
Interest Rate
4.97%
Estimated Equity
$437,980
Purchase Details
Closed on
Jul 3, 2006
Sold by
Craig Company
Bought by
Bowden John F
Home Financials for this Owner
Home Financials are based on the most recent Mortgage that was taken out on this home.
Original Mortgage
$185,144
Interest Rate
7.38%
Purchase Details
Closed on
Feb 28, 2006
Sold by
Drees Premier Homes Inc
Bought by
Meyers Brandi B
Home Financials for this Owner
Home Financials are based on the most recent Mortgage that was taken out on this home.
Original Mortgage
$211,830
Interest Rate
6.05%
Purchase Details
Closed on
Oct 5, 2005
Bought by
The Craig Company
Create a Home Valuation Report for This Property
The Home Valuation Report is an in-depth analysis detailing your home's value as well as a comparison with similar homes in the area
Home Values in the Area
Average Home Value in this Area
Purchase History
| Date | Buyer | Sale Price | Title Company |
|---|---|---|---|
| Averbukh Lev | $174,300 | -- | |
| Bowden John F | $231,430 | -- | |
| Meyers Brandi B | $264,791 | -- | |
| The Craig Company | $152,700 | -- |
Source: Public Records
Mortgage History
| Date | Status | Borrower | Loan Amount |
|---|---|---|---|
| Open | The Craig Company | $104,300 | |
| Previous Owner | The Craig Company | $185,144 | |
| Previous Owner | The Craig Company | $34,715 | |
| Previous Owner | The Craig Company | $211,830 | |
| Previous Owner | The Craig Company | $39,150 |
Source: Public Records
Tax History Compared to Growth
Tax History
| Year | Tax Paid | Tax Assessment Tax Assessment Total Assessment is a certain percentage of the fair market value that is determined by local assessors to be the total taxable value of land and additions on the property. | Land | Improvement |
|---|---|---|---|---|
| 2024 | $1,695 | $88,775 | $27,500 | $61,275 |
| 2022 | $1,695 | $88,775 | $27,500 | $61,275 |
| 2021 | $1,792 | $88,775 | $27,500 | $61,275 |
| 2020 | $1,798 | $88,775 | $27,500 | $61,275 |
| 2019 | $222 | $66,600 | $20,000 | $46,600 |
| 2018 | $1,789 | $66,600 | $20,000 | $46,600 |
| 2017 | $1,789 | $66,600 | $20,000 | $46,600 |
| 2016 | $1,789 | $66,600 | $20,000 | $46,600 |
| 2015 | $1,845 | $66,600 | $20,000 | $46,600 |
| 2014 | $1,488 | $53,723 | $0 | $0 |
Source: Public Records
Map
Nearby Homes
- 2116 Putnam Ln
- 2031 Hidden Cove Rd
- 3294 Camden Ct
- 3059 Kirkland Cir
- 3061 Kirkland Cir
- 431 Waterbrook Dr
- 3063 Kirkland Cir
- 611 Heritage Dr
- 3067 Kirkland Cir
- 532 Millwood Ln
- 537 Millwood Ln
- 4600 Boxcroft Cir
- 4617 Boxcroft Cir
- 3400 Acadia Ln
- 3020 Kingston Cir N
- 2976 Kingston Cir S
- 408 Everlee Ln
- 2543 Pine Valley Rd
- 304 Blackland Dr
- 3017 Kingston Cir N
- 926 Legacy Park Rd
- 930 Legacy Park Rd
- 932 Legacy Park Rd
- 924 Legacy Park Rd
- 934 Legacy Park Rd
- 922 Legacy Park Rd
- 937 Legacy Park Rd
- 939 Legacy Park Rd
- 935 Legacy Park Rd
- 933 Legacy Park Rd
- 941 Legacy Park Rd
- 936 Legacy Park Rd
- 920 Legacy Park Rd
- 931 Legacy Park Rd
- 943 Legacy Park Rd
- 918 Legacy Park Rd
- 1000 Stafford Dr
- 929 Legacy Park Rd
- 945 Legacy Park Rd
- 2111 Putnam Ln