Estimated Value: $76,000 - $202,000
3
Beds
2
Baths
1,200
Sq Ft
$135/Sq Ft
Est. Value
About This Home
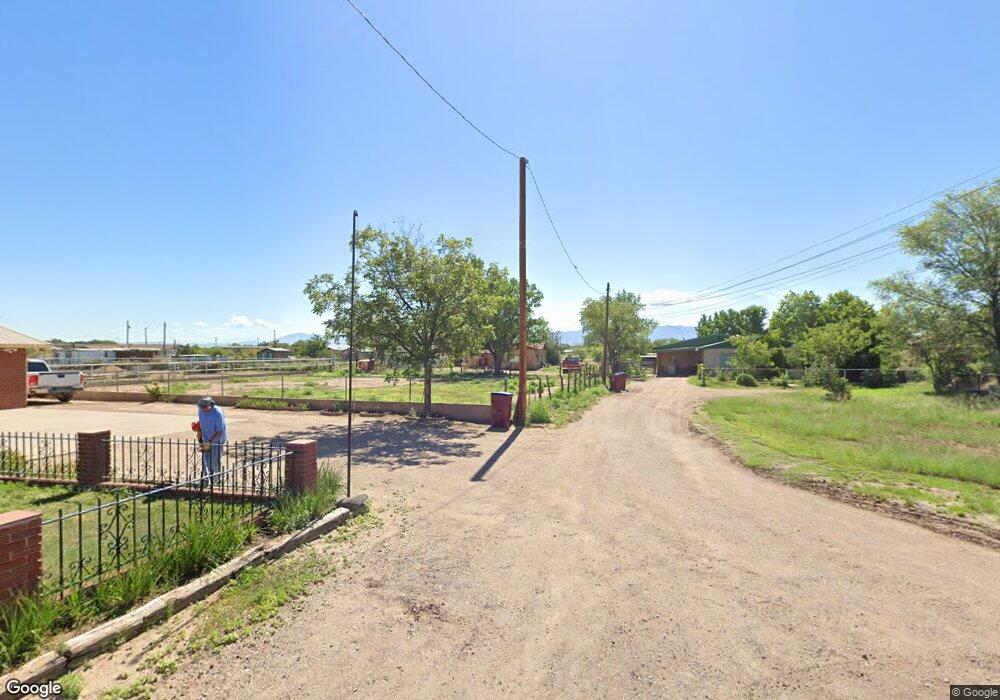
This home is located at 928 N 10th St Unit B, Belen, NM 87002 and is currently estimated at $162,374, approximately $135 per square foot. 928 N 10th St Unit B is a home located in Valencia County with nearby schools including Belen High School, St. Mary's School, and Canon Christian Academy.
Ownership History
Date
Name
Owned For
Owner Type
Purchase Details
Closed on
Aug 8, 2008
Sold by
Papaconstantinou Lambros and Paros Eleni
Bought by
Barela Julien F
Current Estimated Value
Home Financials for this Owner
Home Financials are based on the most recent Mortgage that was taken out on this home.
Original Mortgage
$84,440
Outstanding Balance
$55,665
Interest Rate
6.42%
Mortgage Type
FHA
Estimated Equity
$106,709
Purchase Details
Closed on
Jun 6, 2008
Sold by
Jubb Keith R and Jubb Bernie F
Bought by
Paros Elini and Papaconstantinou Lambros
Home Financials for this Owner
Home Financials are based on the most recent Mortgage that was taken out on this home.
Original Mortgage
$84,440
Interest Rate
6.42%
Mortgage Type
FHA
Purchase Details
Closed on
Jun 1, 2006
Sold by
Jubb Keith R and Jubb Bernie F
Bought by
Paros Eleni and Papaconstantinou Lambros
Home Financials for this Owner
Home Financials are based on the most recent Mortgage that was taken out on this home.
Original Mortgage
$34,000
Interest Rate
6.56%
Create a Home Valuation Report for This Property
The Home Valuation Report is an in-depth analysis detailing your home's value as well as a comparison with similar homes in the area
Home Values in the Area
Average Home Value in this Area
Purchase History
| Date | Buyer | Sale Price | Title Company |
|---|---|---|---|
| Barela Julien F | -- | None Available | |
| Paros Elini | -- | None Available | |
| Paros Eleni | $35,000 | None Available |
Source: Public Records
Mortgage History
| Date | Status | Borrower | Loan Amount |
|---|---|---|---|
| Open | Barela Julien F | $84,440 | |
| Previous Owner | Paros Elini | $84,440 | |
| Previous Owner | Paros Eleni | $34,000 |
Source: Public Records
Tax History Compared to Growth
Tax History
| Year | Tax Paid | Tax Assessment Tax Assessment Total Assessment is a certain percentage of the fair market value that is determined by local assessors to be the total taxable value of land and additions on the property. | Land | Improvement |
|---|---|---|---|---|
| 2024 | $631 | $16,872 | $8,333 | $8,539 |
| 2023 | $631 | $16,381 | $8,333 | $8,048 |
| 2022 | $588 | $15,904 | $8,333 | $7,571 |
| 2021 | $546 | $15,441 | $8,583 | $6,858 |
| 2020 | $539 | $14,991 | $8,333 | $6,658 |
| 2019 | $539 | $14,991 | $8,333 | $6,658 |
| 2018 | $533 | $14,991 | $8,573 | $6,418 |
| 2017 | $454 | $14,555 | $8,137 | $6,418 |
| 2016 | $448 | $14,555 | $8,137 | $6,418 |
| 2015 | -- | $14,132 | $7,465 | $6,667 |
| 2013 | -- | $14,129 | $8,840 | $5,289 |
| 2011 | -- | $42,387 | $26,520 | $15,867 |
Source: Public Records
Map
Nearby Homes
- 1010 Santa Anita Dr
- 103 Rosedale Cir
- 1019 Santa Anita Dr
- 911 Impala Dr
- 200 Garcia Ave
- 1014 W Picard Ave
- 410 N Lala St
- 406 N Lala St
- 402 N Lala St
- 523 N 4th St
- - Somerset St
- 609 N 3rd St
- 222 N Main St
- 612 N 3rd St
- 1212 W Reinken Ave
- 0 Goebel Ave
- 1603 Ben San Ave
- 106 W Ross Ave
- 0 N 2nd St
- 1205 W Delgado Ave
- 924 N 10th St
- 914 Molina Place
- 926 N 10th St
- 916 Molina Place
- 925 Cavalier Ave
- 912 Molina Place
- 918 Molina Place
- 925 N 10th St
- 9200 Molina Place
- 920 Molina Place
- 910 Molina Place
- 913 Cavalier Ave
- 908 W Aragon Rd
- 731 Don Felipe Rd
- 919 Cavalier Ave
- 906 W Aragon Rd
- 943 Cavalier Ave
- 911 Cavalier Ave
- 904 W Aragon Rd
- 1002 W Aragon Rd