Estimated Value: $47,000 - $106,000
--
Bed
1
Bath
784
Sq Ft
$82/Sq Ft
Est. Value
About This Home
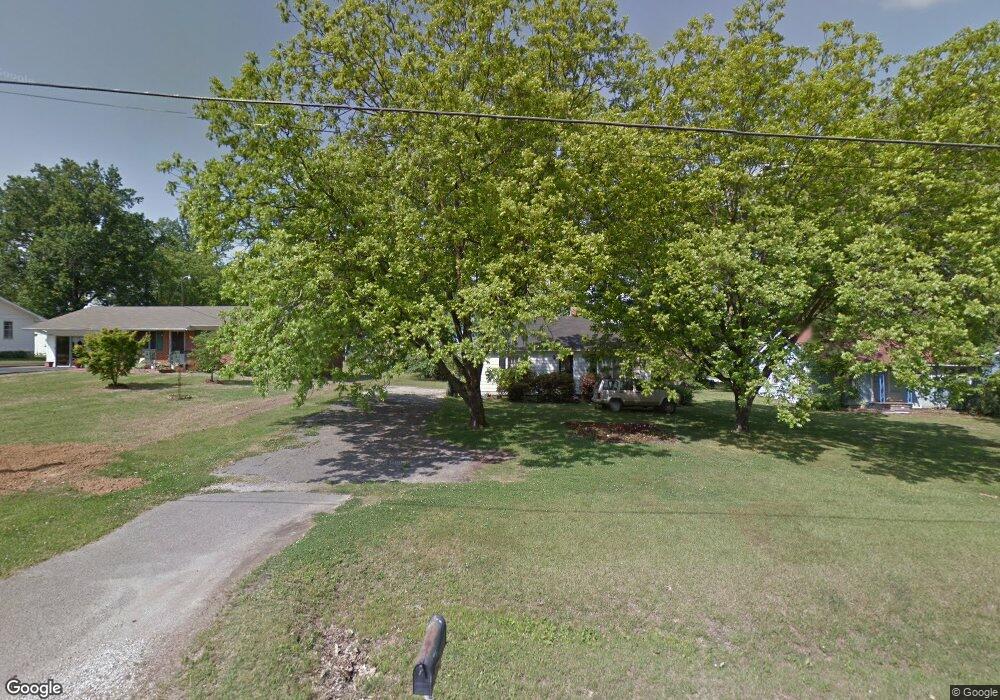
This home is located at 928 N Main St Unit R3, Dyer, TN 38330 and is currently estimated at $64,118, approximately $81 per square foot. 928 N Main St Unit R3 is a home located in Gibson County with nearby schools including Dyer Elementary School and Gibson County High School.
Ownership History
Date
Name
Owned For
Owner Type
Purchase Details
Closed on
Feb 18, 2022
Sold by
Gadlen Patsy R
Bought by
Sanders Veronica Gadlen
Current Estimated Value
Purchase Details
Closed on
Mar 4, 2005
Sold by
Caldwell Melody Dycus
Bought by
Chartrand Mark
Home Financials for this Owner
Home Financials are based on the most recent Mortgage that was taken out on this home.
Original Mortgage
$9,000
Interest Rate
5.6%
Purchase Details
Closed on
Feb 24, 2005
Sold by
Caldwell Melody Dycus
Bought by
Vanray Guiden Van
Home Financials for this Owner
Home Financials are based on the most recent Mortgage that was taken out on this home.
Original Mortgage
$9,000
Interest Rate
5.6%
Purchase Details
Closed on
Aug 20, 1993
Bought by
Dycus Lloyd
Purchase Details
Closed on
Jan 17, 1989
Bought by
Parker John A Mary
Purchase Details
Closed on
Sep 2, 1972
Bought by
Parker John A and Parker Mary
Create a Home Valuation Report for This Property
The Home Valuation Report is an in-depth analysis detailing your home's value as well as a comparison with similar homes in the area
Home Values in the Area
Average Home Value in this Area
Purchase History
| Date | Buyer | Sale Price | Title Company |
|---|---|---|---|
| Sanders Veronica Gadlen | $5,945 | Collins & Hill Pllc | |
| Chartrand Mark | $10,000 | -- | |
| Vanray Guiden Van | $10,000 | -- | |
| Dycus Lloyd | $5,000 | -- | |
| Parker John A Mary | $3,000 | -- | |
| Parker John A | -- | -- |
Source: Public Records
Mortgage History
| Date | Status | Borrower | Loan Amount |
|---|---|---|---|
| Previous Owner | Parker John A | $9,000 |
Source: Public Records
Tax History Compared to Growth
Tax History
| Year | Tax Paid | Tax Assessment Tax Assessment Total Assessment is a certain percentage of the fair market value that is determined by local assessors to be the total taxable value of land and additions on the property. | Land | Improvement |
|---|---|---|---|---|
| 2024 | $341 | $9,850 | $2,000 | $7,850 |
| 2023 | $161 | $5,175 | $700 | $4,475 |
| 2022 | $157 | $5,175 | $700 | $4,475 |
| 2021 | $157 | $5,175 | $700 | $4,475 |
| 2020 | $257 | $5,175 | $700 | $4,475 |
| 2019 | $242 | $5,175 | $700 | $4,475 |
| 2018 | $238 | $4,700 | $700 | $4,000 |
| 2017 | $229 | $4,700 | $700 | $4,000 |
| 2016 | $229 | $4,700 | $700 | $4,000 |
| 2015 | $208 | $4,700 | $700 | $4,000 |
| 2014 | $192 | $4,350 | $700 | $3,650 |
Source: Public Records
Map
Nearby Homes
- 173 Orr Rd
- 23 Gravettes Crossing Rd W
- 117 Washington St
- 0 Royal St
- 208 & 210 Lee St
- 205 Division St
- 288 W Broad St
- 142 S Poplar St
- 139 Peach St
- 354 E Maple St
- 299 E Walnut St
- 217 Central St
- 153 New Hope St
- 163 Monroe St
- 548 E College St
- 137 W South St
- 246 Thomas St
- 0 Reed Rd
- 107 Hopper St
- 130 Callis Dr