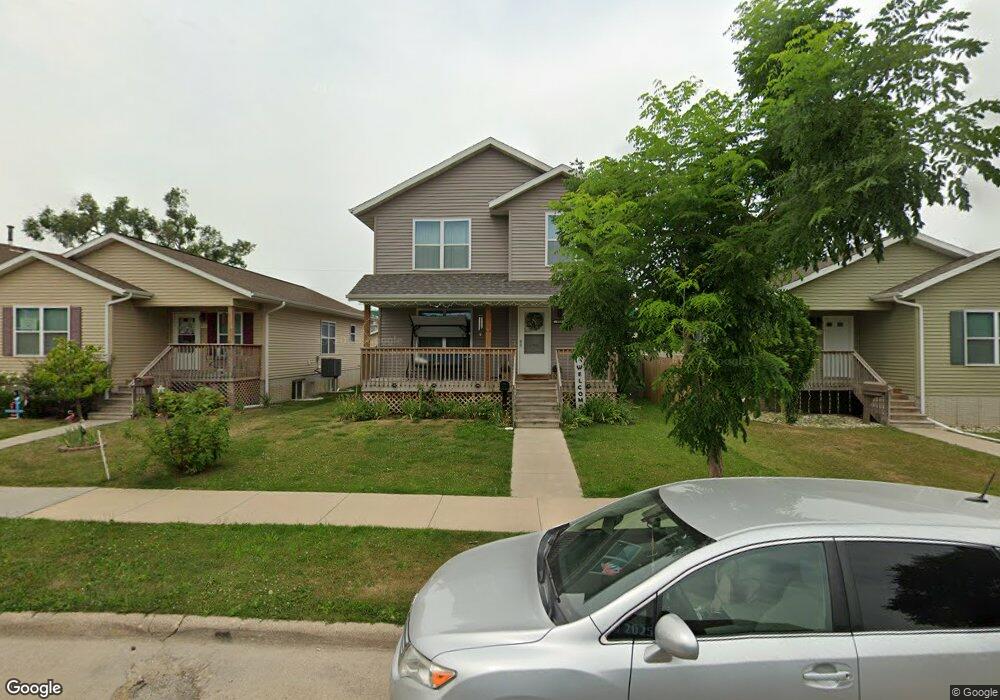
928 N St SW Cedar Rapids, IA 52404
Taylor NeighborhoodEstimated Value: $164,000 - $218,000
4
Beds
3
Baths
1,260
Sq Ft
$154/Sq Ft
Est. Value
About This Home
This home is located at 928 N St SW, Cedar Rapids, IA 52404 and is currently estimated at $193,955, approximately $153 per square foot. 928 N St SW is a home with nearby schools including Junction City Elementary School, Cedar River Academy at Taylor Elementary School, and Bruce Hall Day Treatment Center.
Ownership History
Date
Name
Owned For
Owner Type
Purchase Details
Closed on
Jan 26, 2016
Sold by
Hope Community Development Association I
Bought by
Harrison Danielle
Current Estimated Value
Home Financials for this Owner
Home Financials are based on the most recent Mortgage that was taken out on this home.
Original Mortgage
$112,500
Outstanding Balance
$89,828
Interest Rate
4%
Mortgage Type
New Conventional
Estimated Equity
$104,127
Purchase Details
Closed on
Nov 19, 2014
Sold by
City Of Cedar Rapids
Bought by
Hope Community Development Assn Inc
Purchase Details
Closed on
Sep 14, 2011
Sold by
Shea Daniel and Shea Kathy
Bought by
City Of Cedar Rapids Iowa
Create a Home Valuation Report for This Property
The Home Valuation Report is an in-depth analysis detailing your home's value as well as a comparison with similar homes in the area
Home Values in the Area
Average Home Value in this Area
Purchase History
| Date | Buyer | Sale Price | Title Company |
|---|---|---|---|
| Harrison Danielle | -- | None Available | |
| Hope Community Development Assn Inc | -- | None Available | |
| City Of Cedar Rapids Iowa | $10,500 | None Available |
Source: Public Records
Mortgage History
| Date | Status | Borrower | Loan Amount |
|---|---|---|---|
| Open | Harrison Danielle | $112,500 |
Source: Public Records
Tax History Compared to Growth
Tax History
| Year | Tax Paid | Tax Assessment Tax Assessment Total Assessment is a certain percentage of the fair market value that is determined by local assessors to be the total taxable value of land and additions on the property. | Land | Improvement |
|---|---|---|---|---|
| 2025 | $3,250 | $212,500 | $26,300 | $186,200 |
| 2024 | $3,596 | $194,100 | $24,200 | $169,900 |
| 2023 | $3,596 | $194,100 | $24,200 | $169,900 |
| 2022 | $3,146 | $179,400 | $20,200 | $159,200 |
| 2021 | $3,286 | $160,800 | $20,200 | $140,600 |
| 2020 | $3,286 | $157,500 | $18,200 | $139,300 |
| 2019 | $3,102 | $152,400 | $18,200 | $134,200 |
| 2018 | $2,932 | $152,400 | $18,200 | $134,200 |
| 2017 | $2,932 | $116,000 | $18,200 | $97,800 |
| 2016 | $330 | $15,500 | $15,500 | $0 |
| 2015 | $330 | $0 | $0 | $0 |
| 2014 | -- | $0 | $0 | $0 |
| 2013 | $158 | $0 | $0 | $0 |
Source: Public Records
Map
Nearby Homes