Estimated Value: $288,787 - $321,000
4
Beds
2
Baths
2,052
Sq Ft
$151/Sq Ft
Est. Value
About This Home
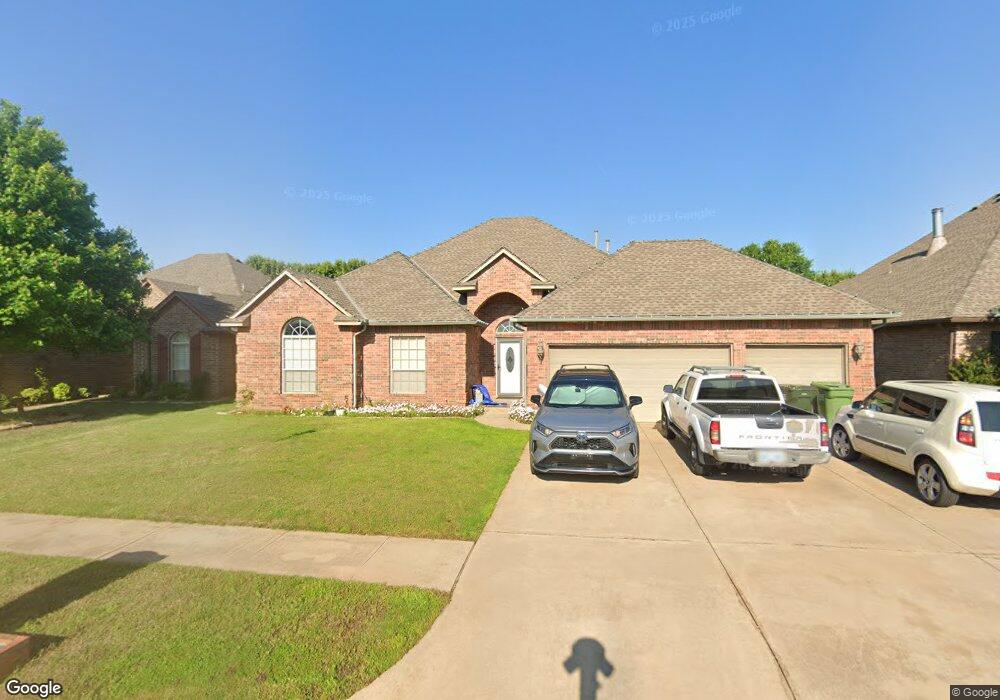
This home is located at 928 Regal Rd, Yukon, OK 73099 and is currently estimated at $310,697, approximately $151 per square foot. 928 Regal Rd is a home located in Canadian County with nearby schools including Skyview Elementary School, Lakeview Elementary School, and Yukon Middle School.
Ownership History
Date
Name
Owned For
Owner Type
Purchase Details
Closed on
Oct 21, 2013
Sold by
Nguyen David Q and Nguyen Mary
Bought by
Nguyen David Q and Nguyen Mary
Current Estimated Value
Home Financials for this Owner
Home Financials are based on the most recent Mortgage that was taken out on this home.
Original Mortgage
$124,638
Outstanding Balance
$93,181
Interest Rate
4.37%
Mortgage Type
New Conventional
Estimated Equity
$217,516
Purchase Details
Closed on
Sep 13, 2004
Sold by
Schlumar Inc Dba Semco~Homes
Home Financials for this Owner
Home Financials are based on the most recent Mortgage that was taken out on this home.
Original Mortgage
$179,874
Interest Rate
5.95%
Purchase Details
Closed on
Jan 20, 2004
Sold by
Cypert Claud A and Cypert Betty K
Home Financials for this Owner
Home Financials are based on the most recent Mortgage that was taken out on this home.
Original Mortgage
$141,043
Interest Rate
5.9%
Create a Home Valuation Report for This Property
The Home Valuation Report is an in-depth analysis detailing your home's value as well as a comparison with similar homes in the area
Home Values in the Area
Average Home Value in this Area
Purchase History
| Date | Buyer | Sale Price | Title Company |
|---|---|---|---|
| Nguyen David Q | -- | Service Link | |
| -- | $180,000 | -- | |
| -- | $22,500 | -- |
Source: Public Records
Mortgage History
| Date | Status | Borrower | Loan Amount |
|---|---|---|---|
| Open | Nguyen David Q | $124,638 | |
| Closed | -- | $179,874 | |
| Previous Owner | -- | $141,043 |
Source: Public Records
Tax History Compared to Growth
Tax History
| Year | Tax Paid | Tax Assessment Tax Assessment Total Assessment is a certain percentage of the fair market value that is determined by local assessors to be the total taxable value of land and additions on the property. | Land | Improvement |
|---|---|---|---|---|
| 2024 | $2,879 | $27,899 | $3,600 | $24,299 |
| 2023 | $2,879 | $26,571 | $3,600 | $22,971 |
| 2022 | $2,754 | $25,305 | $3,600 | $21,705 |
| 2021 | $2,631 | $24,100 | $3,600 | $20,500 |
| 2020 | $2,625 | $24,342 | $3,600 | $20,742 |
| 2019 | $2,709 | $25,042 | $3,600 | $21,442 |
| 2018 | $2,588 | $23,850 | $3,600 | $20,250 |
| 2017 | $2,588 | $23,850 | $3,600 | $20,250 |
| 2016 | $2,512 | $23,179 | $3,600 | $19,579 |
| 2015 | $2,429 | $22,034 | $3,600 | $18,434 |
| 2014 | $2,429 | $22,034 | $3,600 | $18,434 |
Source: Public Records
Map
Nearby Homes
- 1004 Majestic Ave
- 1204 Excalibur Ct
- 1020 Majestic Ave
- 633 Eastview Dr
- 2700 Del Corso Ave
- 1321 Camelot Dr
- 2913 Canyon Berry Ln
- 2905 Canyon Berry Ln
- 421 Switch Ct
- 3309 Austrian Pine Ln
- 1220 Eastview Cir
- 10824 NW 32nd Terrace
- 10809 NW 27th St
- 10201 NW 28th Terrace
- 10804 NW 28th Terrace
- 10304 NW 28th St
- 10300 NW 28th St
- 10212 NW 28th St
- 10209 NW 28th Terrace
- 10305 NW 28th Terrace