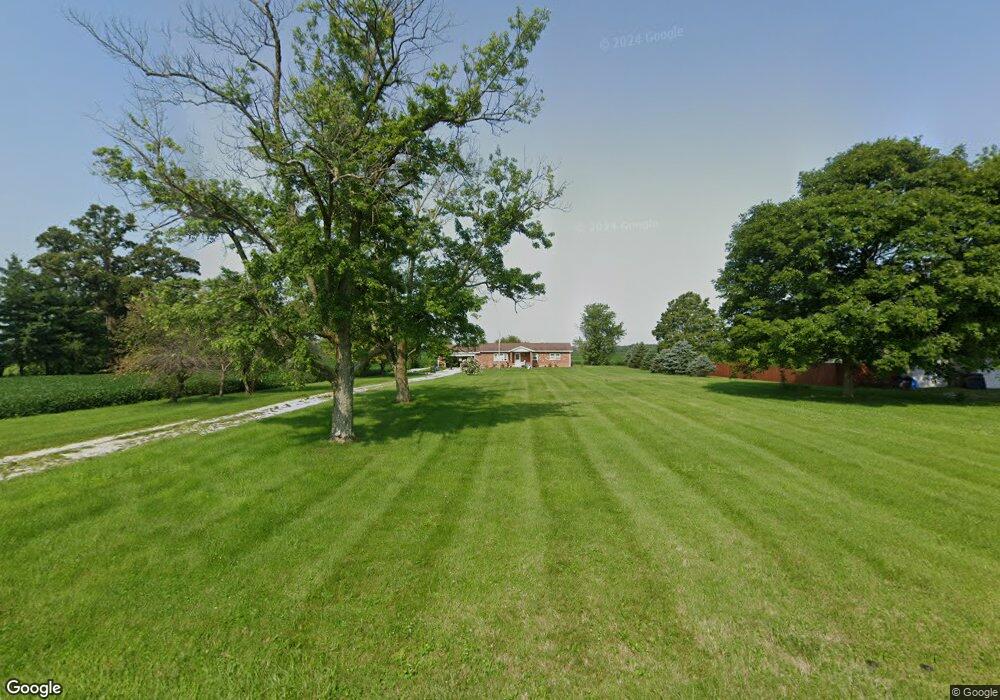
9283 N 100 W Fountaintown, IN 46130
Estimated Value: $193,000 - $324,533
2
Beds
1
Bath
1,248
Sq Ft
$215/Sq Ft
Est. Value
About This Home
This home is located at 9283 N 100 W, Fountaintown, IN 46130 and is currently estimated at $267,883, approximately $214 per square foot. 9283 N 100 W is a home located in Shelby County with nearby schools including Morristown Elementary School and Morristown Junior/Senior High School.
Ownership History
Date
Name
Owned For
Owner Type
Purchase Details
Closed on
Jun 13, 2023
Sold by
Mcallister Ethan D
Bought by
Ethan D Mcallister And Sierra R Mcallister Re
Current Estimated Value
Purchase Details
Closed on
Jul 28, 2006
Sold by
Moore B Jean
Bought by
Mcallister Eddy
Home Financials for this Owner
Home Financials are based on the most recent Mortgage that was taken out on this home.
Original Mortgage
$16,500
Interest Rate
6.85%
Mortgage Type
Stand Alone Second
Create a Home Valuation Report for This Property
The Home Valuation Report is an in-depth analysis detailing your home's value as well as a comparison with similar homes in the area
Home Values in the Area
Average Home Value in this Area
Purchase History
| Date | Buyer | Sale Price | Title Company |
|---|---|---|---|
| Ethan D Mcallister And Sierra R Mcallister Re | -- | None Listed On Document | |
| Mcallister Eddy | -- | -- |
Source: Public Records
Mortgage History
| Date | Status | Borrower | Loan Amount |
|---|---|---|---|
| Previous Owner | Mcallister Eddy | $16,500 | |
| Previous Owner | Mcallister Eddy | $88,000 |
Source: Public Records
Tax History Compared to Growth
Tax History
| Year | Tax Paid | Tax Assessment Tax Assessment Total Assessment is a certain percentage of the fair market value that is determined by local assessors to be the total taxable value of land and additions on the property. | Land | Improvement |
|---|---|---|---|---|
| 2024 | $2,031 | $233,400 | $60,400 | $173,000 |
| 2023 | $2,064 | $227,600 | $60,400 | $167,200 |
| 2022 | $2,099 | $221,400 | $60,400 | $161,000 |
| 2021 | $1,963 | $207,600 | $60,400 | $147,200 |
| 2020 | $1,882 | $205,400 | $60,400 | $145,000 |
| 2019 | $1,658 | $186,100 | $59,900 | $126,200 |
| 2018 | $1,535 | $174,400 | $59,900 | $114,500 |
| 2017 | $1,458 | $172,200 | $59,900 | $112,300 |
| 2016 | $1,397 | $176,500 | $59,900 | $116,600 |
| 2014 | $1,284 | $168,600 | $58,800 | $109,800 |
| 2013 | $1,284 | $164,100 | $58,200 | $105,900 |
Source: Public Records
Map
Nearby Homes
- 256 E 1000 N
- 10686 N Division Rd
- 11131 N State Road 9
- 11497 N State Road 9
- 5 U S 52
- 6 U S 52
- 83 E Walnut St
- 1744 E 850 N
- 1898 E 1000 N
- 11600 N 100 E
- 11546 N Shelby 300 W
- 1069 W Railroad St
- 5465 S Greenfield St
- 5477 S Main St
- 661 W 500 S
- 5555 S 200 E
- 2903 E Freeport Rd
- 8825 N 300 E
- 8968 N 300 E
- 10812 N Blue River Trail