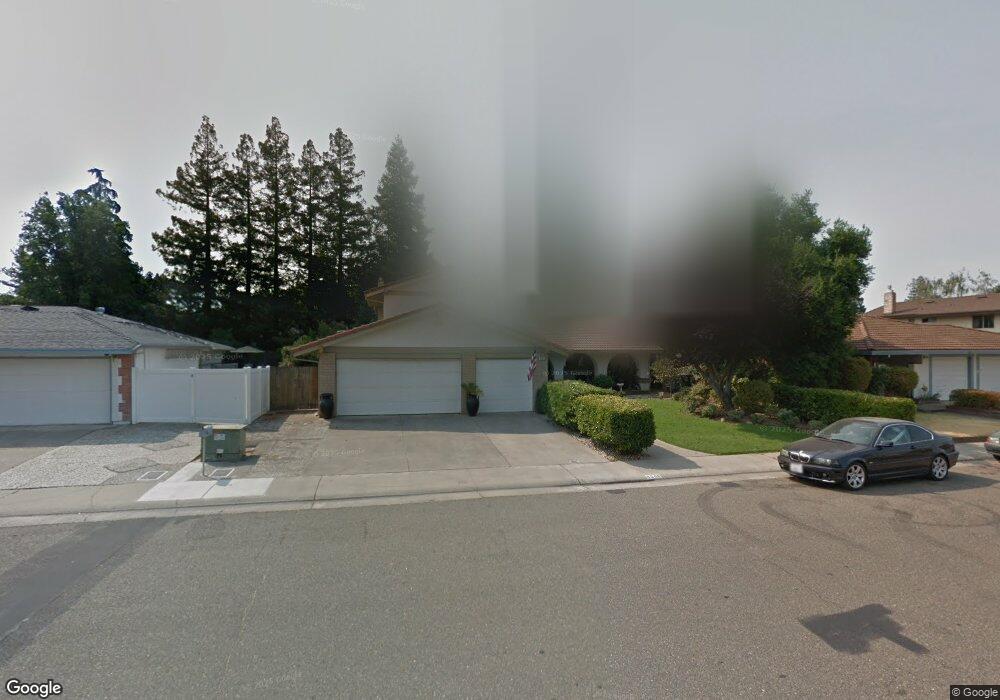
9288 Emerald Vista Dr Elk Grove, CA 95624
North East Elk Grove NeighborhoodEstimated Value: $493,000 - $631,015
4
Beds
3
Baths
2,097
Sq Ft
$282/Sq Ft
Est. Value
About This Home
This home is located at 9288 Emerald Vista Dr, Elk Grove, CA 95624 and is currently estimated at $590,504, approximately $281 per square foot. 9288 Emerald Vista Dr is a home located in Sacramento County with nearby schools including Ellen Feickert Elementary School, Joseph Kerr Middle School, and Elk Grove High School.
Ownership History
Date
Name
Owned For
Owner Type
Purchase Details
Closed on
Mar 7, 2024
Sold by
Lopez Baleriana and Tenant As A
Bought by
Rocha Jose
Current Estimated Value
Purchase Details
Closed on
Aug 2, 2006
Sold by
Idler Patrick M and Idler Adelay E
Bought by
Rocha Jose and Lopez Baleriana
Home Financials for this Owner
Home Financials are based on the most recent Mortgage that was taken out on this home.
Original Mortgage
$320,000
Interest Rate
7.42%
Mortgage Type
Purchase Money Mortgage
Purchase Details
Closed on
Feb 14, 2006
Sold by
Idler Patrick M and Idler Adelay E
Bought by
Idler Patrick M and Idler Adelay E
Purchase Details
Closed on
Sep 1, 2005
Sold by
Idler Patrick M and Idler Adelay E
Bought by
Idler Patrick M and Idler Adelay E
Purchase Details
Closed on
Jan 7, 1997
Sold by
Idler Patrick M and Idler Adelay E
Bought by
Idler Patrick M and Idler Adelay E
Create a Home Valuation Report for This Property
The Home Valuation Report is an in-depth analysis detailing your home's value as well as a comparison with similar homes in the area
Home Values in the Area
Average Home Value in this Area
Purchase History
| Date | Buyer | Sale Price | Title Company |
|---|---|---|---|
| Rocha Jose | -- | None Listed On Document | |
| Rocha Jose | $400,000 | Alliance Title Company | |
| Idler Patrick M | -- | None Available | |
| Idler Patrick M | -- | -- | |
| Idler Patrick M | -- | -- |
Source: Public Records
Mortgage History
| Date | Status | Borrower | Loan Amount |
|---|---|---|---|
| Previous Owner | Rocha Jose | $320,000 |
Source: Public Records
Tax History Compared to Growth
Tax History
| Year | Tax Paid | Tax Assessment Tax Assessment Total Assessment is a certain percentage of the fair market value that is determined by local assessors to be the total taxable value of land and additions on the property. | Land | Improvement |
|---|---|---|---|---|
| 2025 | $5,670 | $535,897 | $160,764 | $375,133 |
| 2024 | $5,670 | $525,390 | $157,612 | $367,778 |
| 2023 | $5,521 | $515,089 | $154,522 | $360,567 |
| 2022 | $5,418 | $504,991 | $151,493 | $353,498 |
| 2021 | $5,051 | $467,117 | $140,131 | $326,986 |
| 2020 | $4,424 | $409,752 | $122,922 | $286,830 |
| 2019 | $4,217 | $390,241 | $117,069 | $273,172 |
| 2018 | $4,060 | $378,876 | $113,660 | $265,216 |
| 2017 | $3,769 | $350,812 | $105,241 | $245,571 |
| 2016 | $3,506 | $337,320 | $101,194 | $236,126 |
| 2015 | $3,236 | $312,335 | $93,699 | $218,636 |
| 2014 | $3,150 | $303,238 | $90,970 | $212,268 |
Source: Public Records
Map
Nearby Homes
- 9455 E Stockton Blvd
- 8737 El Toreador Way
- 8392 Red Fox Way
- 8804 On Ct
- 8865 Halverson Dr
- 8770 Superb Cir
- 8288 Primoak Way
- 8896 Kelsey Dr
- 9333 Aizenberg Cir
- 9407 Aizenberg Cir
- 8742 Santa Ridge Cir
- 9497 Sara St
- 8966 Ivanpah Ct
- 8841 Freemark Way
- 48 Calle Linda
- 8200 Burloak Way
- 9011 Quail Cove Dr
- 8930 2nd Ave
- 8904 Hyperia Ct
- 62 Calle Margarita
- 9284 Emerald Vista Dr
- 9292 Emerald Vista Dr
- 8545 Jasmine Crest Ct
- 9280 Emerald Vista Dr
- 8549 Jasmine Crest Ct
- 8541 Jasmine Crest Ct
- 9281 Emerald Vista Dr
- 8535 Jasmine Crest Ct
- 9287 Emerald Vista Dr
- 9291 Emerald Vista Dr
- 9278 Emerald Vista Dr
- 9295 Emerald Vista Dr
- 8531 Jasmine Crest Ct
- 9303 Emerald Vista Dr
- 9257 Elk Crest Dr
- 9260 Elk Crest Dr
- 9276 Emerald Vista Dr
- 8548 Jasmine Crest Ct
- 8544 Jasmine Crest Ct
- 8540 Jasmine Crest Ct