9289 Cliff Springs Trail Unit 67 Columbus, OH 43240
Polaris North NeighborhoodEstimated Value: $365,000 - $446,000
3
Beds
3
Baths
1,583
Sq Ft
$245/Sq Ft
Est. Value
About This Home
This home is located at 9289 Cliff Springs Trail Unit 67, Columbus, OH 43240 and is currently estimated at $387,300, approximately $244 per square foot. 9289 Cliff Springs Trail Unit 67 is a home located in Delaware County with nearby schools including Freedom Trail Elementary School, Olentangy Orange Middle School, and Orange High School.
Ownership History
Date
Name
Owned For
Owner Type
Purchase Details
Closed on
Jul 28, 2023
Sold by
Brown Rebekah A
Bought by
Effah Elizabeth
Current Estimated Value
Home Financials for this Owner
Home Financials are based on the most recent Mortgage that was taken out on this home.
Original Mortgage
$303,600
Outstanding Balance
$296,500
Interest Rate
6.67%
Mortgage Type
New Conventional
Estimated Equity
$90,800
Purchase Details
Closed on
Dec 27, 2011
Sold by
Dominion Homes Inc
Bought by
Plant Trever R
Home Financials for this Owner
Home Financials are based on the most recent Mortgage that was taken out on this home.
Original Mortgage
$145,706
Interest Rate
3.87%
Mortgage Type
FHA
Create a Home Valuation Report for This Property
The Home Valuation Report is an in-depth analysis detailing your home's value as well as a comparison with similar homes in the area
Home Values in the Area
Average Home Value in this Area
Purchase History
| Date | Buyer | Sale Price | Title Company |
|---|---|---|---|
| Effah Elizabeth | $330,000 | Vault Title | |
| Plant Trever R | $149,500 | Alliance Title |
Source: Public Records
Mortgage History
| Date | Status | Borrower | Loan Amount |
|---|---|---|---|
| Open | Effah Elizabeth | $303,600 | |
| Previous Owner | Plant Trever R | $145,706 |
Source: Public Records
Tax History Compared to Growth
Tax History
| Year | Tax Paid | Tax Assessment Tax Assessment Total Assessment is a certain percentage of the fair market value that is determined by local assessors to be the total taxable value of land and additions on the property. | Land | Improvement |
|---|---|---|---|---|
| 2024 | $5,221 | $95,870 | $16,980 | $78,890 |
| 2023 | $5,240 | $95,870 | $16,980 | $78,890 |
| 2022 | $4,836 | $72,040 | $14,110 | $57,930 |
| 2021 | $4,863 | $72,040 | $14,110 | $57,930 |
| 2020 | $4,890 | $72,040 | $14,110 | $57,930 |
| 2019 | $3,828 | $58,590 | $12,250 | $46,340 |
| 2018 | $3,845 | $58,590 | $12,250 | $46,340 |
| 2017 | $3,475 | $49,280 | $12,250 | $37,030 |
| 2016 | $3,444 | $49,280 | $12,250 | $37,030 |
| 2015 | $3,146 | $49,280 | $12,250 | $37,030 |
| 2014 | $3,191 | $49,280 | $12,250 | $37,030 |
| 2013 | $3,264 | $49,280 | $12,250 | $37,030 |
Source: Public Records
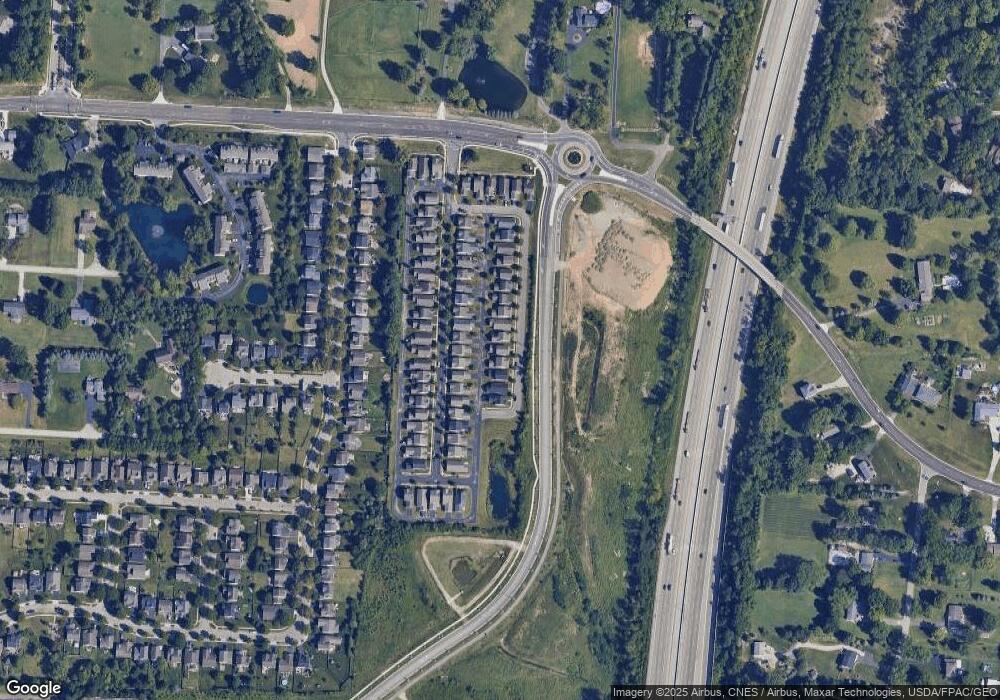
Map
Nearby Homes
- 1627 Bristol Commons Place
- 3138 E Powell Rd
- 3313 Glen Oaks Ct
- 2715 Tucker Trail
- 2251 Tucker Trail
- 9182 Gramford St Unit 9182
- 9146 Gramford St Unit 9146
- 9168 Tahoma St
- 3679 Birkland Cir
- 7697 Bale Kenyon Rd
- 8322 Aurora Ct
- 1746 E Powell Rd
- 7631 Pleasant Colony Ct
- 2216 Reeves Ave
- 975 Adara Dr Unit 6975
- 2363 Pleasant Colony Dr
- 2165 Ben Brush Place
- 8293 Mira St Unit 175
- 2383 Bold Venture Dr
- 1923 Myrtle St
- 9289 Cliff Springs Trail
- 9285 Cliff Springs Trail
- 9281 Cliff Springs Trail
- 9297 Cliff Springs Trail
- 9297 Cliff Springs Trail Unit 65
- 9288 Polaris Green Dr
- 9277 Cliff Springs Trail Unit 70
- 9277 Cliff Springs Trail
- 9292 Polaris Green Dr
- 9284 Polaris Green Dr
- 9284 Polaris Green Dr Unit 39
- 9296 Polaris Green Dr
- 9296 Polaris Green Dr Unit 42
- 9280 Polaris Green Dr
- 9280 Polaris Green Dr Unit 38
- 9273 Cliff Springs Trail
- 9300 Polaris Green Dr
- 9305 Cliff Springs Trail
- 9276 Polaris Green Dr
- 9276 Polaris Green Dr Unit 37