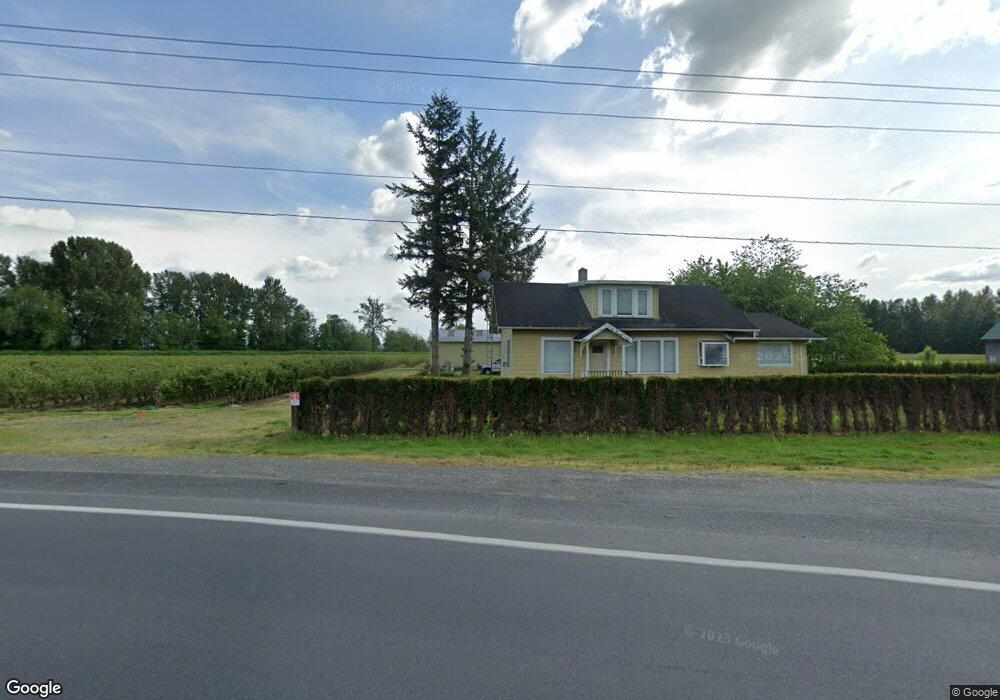
929 Hampton Rd Lynden, WA 98264
Estimated Value: $534,949 - $554,000
3
Beds
2
Baths
1,574
Sq Ft
$346/Sq Ft
Est. Value
About This Home
This home is located at 929 Hampton Rd, Lynden, WA 98264 and is currently estimated at $544,475, approximately $345 per square foot. 929 Hampton Rd is a home located in Whatcom County with nearby schools including Lynden High School, Lynden Christian School, and Lynden Christian Schools: Administration.
Ownership History
Date
Name
Owned For
Owner Type
Purchase Details
Closed on
Feb 9, 2012
Sold by
Vankirk David and Vankirk Van Kirk
Bought by
Ghuman Satnam S and Ghuman Jaswinder K
Current Estimated Value
Home Financials for this Owner
Home Financials are based on the most recent Mortgage that was taken out on this home.
Original Mortgage
$136,500
Outstanding Balance
$92,539
Interest Rate
3.9%
Mortgage Type
New Conventional
Estimated Equity
$451,936
Purchase Details
Closed on
Apr 26, 2001
Sold by
Medearis Jeffrey V and Medearis Megan E
Bought by
Vankirk David and Vankirk Ladonna
Home Financials for this Owner
Home Financials are based on the most recent Mortgage that was taken out on this home.
Original Mortgage
$161,350
Interest Rate
6.92%
Create a Home Valuation Report for This Property
The Home Valuation Report is an in-depth analysis detailing your home's value as well as a comparison with similar homes in the area
Purchase History
| Date | Buyer | Sale Price | Title Company |
|---|---|---|---|
| Ghuman Satnam S | $195,280 | Chicago Title Insurance | |
| Vankirk David | $169,850 | Chicago Title Insurance |
Source: Public Records
Mortgage History
| Date | Status | Borrower | Loan Amount |
|---|---|---|---|
| Open | Ghuman Satnam S | $136,500 | |
| Previous Owner | Vankirk David | $161,350 |
Source: Public Records
Tax History
| Year | Tax Paid | Tax Assessment Tax Assessment Total Assessment is a certain percentage of the fair market value that is determined by local assessors to be the total taxable value of land and additions on the property. | Land | Improvement |
|---|---|---|---|---|
| 2025 | $3,933 | $551,408 | $321,025 | $230,383 |
| 2024 | $3,616 | $530,406 | $300,023 | $230,383 |
| 2023 | $3,616 | $530,824 | $309,302 | $221,522 |
| 2022 | $2,307 | $473,442 | $256,173 | $217,269 |
| 2021 | $2,231 | $375,747 | $203,312 | $172,435 |
| 2020 | $1,940 | $188,266 | $35,670 | $152,596 |
| 2019 | $1,759 | $292,968 | $158,521 | $134,447 |
| 2018 | $1,898 | $149,104 | $28,250 | $120,854 |
| 2017 | $1,935 | $131,950 | $25,000 | $106,950 |
| 2016 | $1,946 | $144,607 | $22,640 | $121,967 |
| 2015 | $1,737 | $144,607 | $22,640 | $121,967 |
| 2014 | -- | $152,240 | $33,613 | $118,627 |
| 2013 | -- | $138,428 | $30,683 | $107,745 |
Source: Public Records
Map
Nearby Homes
- 220 Skipping Stone Loop
- 214 Skipping Stone Loop
- 208 Skipping Stone Loop
- 231 Skipping Stone Loop
- 204 Skipping Stone Loop
- 924 E Grover St
- 120 Skipping Stone Loop
- 211 Pebblebrook Dr
- 116 Riverwalk Dr
- 207 Pebblebrook Dr
- 208 Riverwalk Dr
- 208 Pebblebrook Dr
- 204 Pebblebrook Dr
- 1095 Terrace Dr
- 206 Pebblebrook Dr
- 102 Riverwalk Dr
- 104 Riverwalk Dr
- 301 S Park St
- 137 E Cedar Dr
- 915 Front St
Your Personal Tour Guide
Ask me questions while you tour the home.