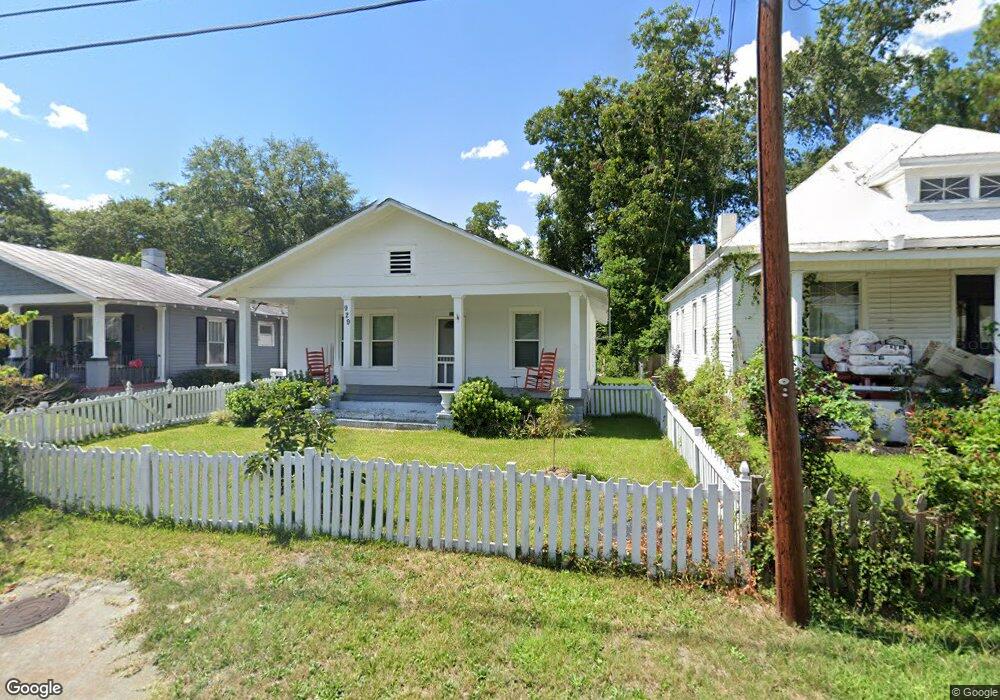
929 Merry St Augusta, GA 30904
Midtown Augusta NeighborhoodEstimated Value: $127,065 - $160,000
2
Beds
1
Bath
1,230
Sq Ft
$113/Sq Ft
Est. Value
About This Home
This home is located at 929 Merry St, Augusta, GA 30904 and is currently estimated at $139,516, approximately $113 per square foot. 929 Merry St is a home located in Richmond County with nearby schools including Monte Sano Elementary School, Johnson Magnet, and Tutt Middle School.
Ownership History
Date
Name
Owned For
Owner Type
Purchase Details
Closed on
Nov 30, 2004
Sold by
Wilson James Calvin and Wilson Elaine S
Bought by
Hancock Jim
Current Estimated Value
Home Financials for this Owner
Home Financials are based on the most recent Mortgage that was taken out on this home.
Original Mortgage
$25,694
Interest Rate
5.6%
Mortgage Type
Purchase Money Mortgage
Purchase Details
Closed on
Jun 19, 2001
Sold by
Morris Carolyn C
Bought by
Wilson James Calvin and Wilson Elaine S
Home Financials for this Owner
Home Financials are based on the most recent Mortgage that was taken out on this home.
Original Mortgage
$32,000
Interest Rate
7.06%
Mortgage Type
Seller Take Back
Purchase Details
Closed on
Jun 30, 1997
Sold by
Coward Joseph M
Bought by
Morris Carolyn C
Purchase Details
Closed on
Jun 18, 1997
Sold by
Cope Connie C
Bought by
Morris Carolyn C
Purchase Details
Closed on
Jun 2, 1997
Sold by
Harvison Betty C
Bought by
Morris Carolyn C
Create a Home Valuation Report for This Property
The Home Valuation Report is an in-depth analysis detailing your home's value as well as a comparison with similar homes in the area
Home Values in the Area
Average Home Value in this Area
Purchase History
| Date | Buyer | Sale Price | Title Company |
|---|---|---|---|
| Hancock Jim | $51,200 | -- | |
| Wilson James Calvin | $32,000 | -- | |
| Morris Carolyn C | -- | -- | |
| Morris Carolyn C | -- | -- | |
| Morris Carolyn C | -- | -- |
Source: Public Records
Mortgage History
| Date | Status | Borrower | Loan Amount |
|---|---|---|---|
| Closed | Hancock Jim | $25,694 | |
| Previous Owner | Wilson James Calvin | $32,000 |
Source: Public Records
Tax History
| Year | Tax Paid | Tax Assessment Tax Assessment Total Assessment is a certain percentage of the fair market value that is determined by local assessors to be the total taxable value of land and additions on the property. | Land | Improvement |
|---|---|---|---|---|
| 2025 | $833 | $49,032 | $5,760 | $43,272 |
| 2024 | $833 | $37,460 | $5,760 | $31,700 |
| 2023 | $439 | $33,927 | $5,760 | $28,167 |
| 2022 | $624 | $29,260 | $5,760 | $23,500 |
| 2021 | $568 | $22,820 | $5,760 | $17,060 |
| 2020 | $548 | $21,269 | $5,760 | $15,509 |
| 2019 | $565 | $21,269 | $5,760 | $15,509 |
| 2018 | $567 | $21,269 | $5,760 | $15,509 |
| 2017 | $567 | $21,269 | $5,760 | $15,509 |
| 2016 | $889 | $21,269 | $5,760 | $15,509 |
| 2015 | $893 | $21,269 | $5,760 | $15,509 |
| 2014 | $956 | $22,992 | $5,760 | $17,232 |
Source: Public Records
Map
Nearby Homes
- 932 Murphy St
- 927 Holden St
- 924 Beman St
- 1906 Jenkins St
- 1843 Jenkins St
- 1936 Warren St
- 1827 Jenkins St
- 1944 Warren St
- 812 Russell St
- 1819 Mcdowell St
- 925 B Russell St
- 1827 Mcdowell St
- 1934 Starnes St
- 1936 Starnes St
- 1938 Starnes St
- 1804 Starnes St
- 1940 Starnes St
- 844 Heard Ave
- 1740 Starnes St
- 930 Heard Ave