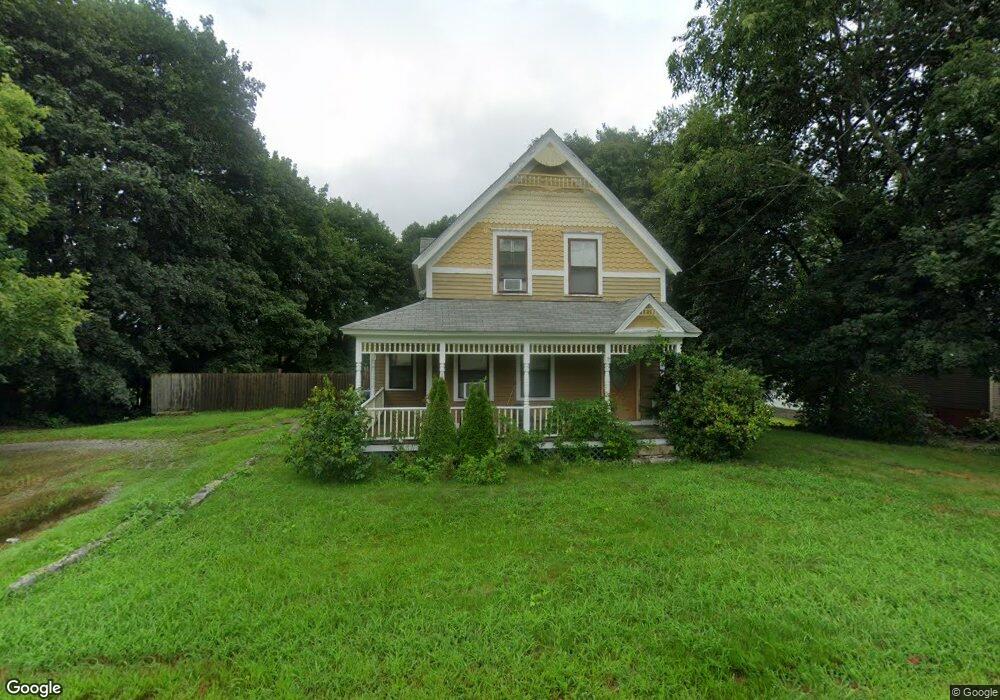
929 N Main St Danielson, CT 06239
Estimated Value: $298,288 - $379,000
3
Beds
1
Bath
1,141
Sq Ft
$285/Sq Ft
Est. Value
About This Home
This home is located at 929 N Main St, Danielson, CT 06239 and is currently estimated at $324,822, approximately $284 per square foot. 929 N Main St is a home located in Windham County with nearby schools including Killingly Central School, Killingly Memorial School, and Killingly Intermediate School.
Ownership History
Date
Name
Owned For
Owner Type
Purchase Details
Closed on
Mar 12, 2010
Sold by
Fnma
Bought by
Hagen Arthur J
Current Estimated Value
Purchase Details
Closed on
Feb 18, 2010
Sold by
Bac Home Loans Servici
Bought by
Federal National Mortgage Association
Purchase Details
Closed on
Dec 23, 2009
Sold by
Orlando Michael P and Orlando Holly A
Bought by
Countrywide Home Loans
Purchase Details
Closed on
Sep 23, 2002
Sold by
Ambrek Sherry
Bought by
Orlando Michael P and Orlando Holly A
Create a Home Valuation Report for This Property
The Home Valuation Report is an in-depth analysis detailing your home's value as well as a comparison with similar homes in the area
Home Values in the Area
Average Home Value in this Area
Purchase History
We collect this data history from publicly available records. To have your information removed, we recommend requesting removal directly through your county’s website.
| Date | Buyer | Sale Price | Title Company |
|---|---|---|---|
| Hagen Arthur J | $58,000 | -- | |
| Hagen Arthur J | $58,000 | -- | |
| Federal National Mortgage Association | -- | -- | |
| Federal National Mortgage Association | -- | -- | |
| Countrywide Home Loans | -- | -- | |
| Countrywide Home Loans | -- | -- | |
| Orlando Michael P | $122,000 | -- | |
| Orlando Michael P | $122,000 | -- |
Source: Public Records
Mortgage History
We collect this data history from publicly available records. To have your information removed, we recommend requesting removal directly through your county’s website.
| Date | Status | Borrower | Loan Amount |
|---|---|---|---|
| Previous Owner | Orlando Michael P | $26,479 | |
| Previous Owner | Orlando Michael P | $181,000 |
Source: Public Records
Tax History
| Year | Tax Paid | Tax Assessment Tax Assessment Total Assessment is a certain percentage of the fair market value that is determined by local assessors to be the total taxable value of land and additions on the property. | Land | Improvement |
|---|---|---|---|---|
| 2025 | $3,413 | $145,550 | $27,850 | $117,700 |
| 2024 | $3,212 | $145,550 | $27,850 | $117,700 |
| 2023 | $3,257 | $113,680 | $23,100 | $90,580 |
| 2022 | $3,059 | $113,680 | $23,100 | $90,580 |
| 2021 | $3,059 | $113,680 | $23,100 | $90,580 |
| 2020 | $2,994 | $113,680 | $23,100 | $90,580 |
| 2019 | $3,053 | $113,680 | $23,100 | $90,580 |
| 2017 | $2,595 | $88,830 | $14,840 | $73,990 |
| 2016 | $2,586 | $88,830 | $14,840 | $73,990 |
| 2015 | $2,604 | $88,830 | $14,840 | $73,990 |
| 2014 | $2,533 | $88,830 | $14,840 | $73,990 |
Source: Public Records
Map
Nearby Homes
- 16 Conrad's Park
- 1032 N Main St Unit 3
- 39 Valley View Dr Unit 14B
- 37 Valley View Dr Unit 14A
- 14 Valley View Dr
- 16 Valley View Dr
- 61 Deerwood Dr
- 43 Woodward St
- 654 N Main St
- 760 Upper Maple St
- 11 Athol St
- 48 Athol St Unit 48
- 74 Athol St
- 14 Maryland St
- 842 Hartford Pike
- 395 Maple St
- 11 Otis St
- 29 Rosedale St
- 438 Hartford Pike
- 23 Winter St
Your Personal Tour Guide
Ask me questions while you tour the home.