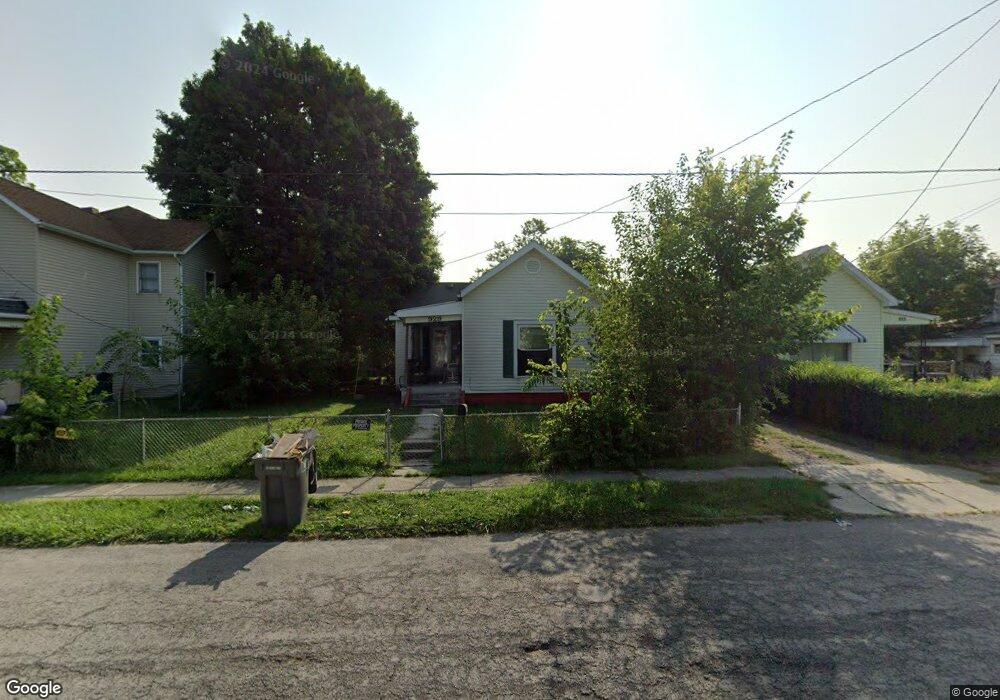
929 S Elizabeth St Lima, OH 45804
Fifth Ward NeighborhoodEstimated Value: $35,000 - $100,000
4
Beds
1
Bath
1,124
Sq Ft
$53/Sq Ft
Est. Value
About This Home
This home is located at 929 S Elizabeth St, Lima, OH 45804 and is currently estimated at $59,804, approximately $53 per square foot. 929 S Elizabeth St is a home located in Allen County with nearby schools including Unity Elementary School, Lima North Middle School, and Lima West Middle School.
Ownership History
Date
Name
Owned For
Owner Type
Purchase Details
Closed on
Aug 8, 2024
Sold by
Haley Randolph S and Schwartz Mary Jane
Bought by
Pradajects Property Llc
Current Estimated Value
Purchase Details
Closed on
Oct 9, 2018
Sold by
Valle Joe
Bought by
Haley Randolph S and Schwartz Mary Jane
Purchase Details
Closed on
May 21, 2015
Sold by
Fyffe Bobby R
Bought by
Valle Joe
Purchase Details
Closed on
Apr 17, 2002
Sold by
Bank One Na
Bought by
Fyffe Bobby
Purchase Details
Closed on
Feb 4, 2002
Sold by
Brewster Charles
Bought by
Bank One Na
Purchase Details
Closed on
May 27, 1997
Sold by
Mcneil Harold
Bought by
Brewster Charles and Brewster Shanna
Home Financials for this Owner
Home Financials are based on the most recent Mortgage that was taken out on this home.
Original Mortgage
$30,000
Interest Rate
8.24%
Mortgage Type
New Conventional
Purchase Details
Closed on
Aug 1, 1982
Bought by
Mcneil Harold W
Create a Home Valuation Report for This Property
The Home Valuation Report is an in-depth analysis detailing your home's value as well as a comparison with similar homes in the area
Home Values in the Area
Average Home Value in this Area
Purchase History
| Date | Buyer | Sale Price | Title Company |
|---|---|---|---|
| Pradajects Property Llc | $2,000 | None Listed On Document | |
| Haley Randolph S | -- | None Available | |
| Valle Joe | $4,000 | None Available | |
| Fyffe Bobby | $10,000 | -- | |
| Bank One Na | $16,000 | -- | |
| Brewster Charles | $9,750 | -- | |
| Mcneil Harold W | -- | -- |
Source: Public Records
Mortgage History
| Date | Status | Borrower | Loan Amount |
|---|---|---|---|
| Previous Owner | Brewster Charles | $30,000 |
Source: Public Records
Tax History Compared to Growth
Tax History
| Year | Tax Paid | Tax Assessment Tax Assessment Total Assessment is a certain percentage of the fair market value that is determined by local assessors to be the total taxable value of land and additions on the property. | Land | Improvement |
|---|---|---|---|---|
| 2024 | $208 | $3,990 | $1,330 | $2,660 |
| 2023 | $211 | $3,570 | $1,190 | $2,380 |
| 2022 | $210 | $3,570 | $1,190 | $2,380 |
| 2021 | $219 | $3,570 | $1,190 | $2,380 |
| 2020 | $136 | $1,470 | $1,120 | $350 |
| 2019 | $136 | $1,470 | $1,120 | $350 |
| 2018 | $132 | $1,400 | $1,120 | $280 |
| 2017 | $133 | $1,400 | $1,120 | $280 |
| 2016 | $135 | $1,400 | $1,120 | $280 |
| 2015 | $246 | $6,550 | $1,120 | $5,430 |
| 2014 | $345 | $5,600 | $1,050 | $4,550 |
| 2013 | $337 | $5,600 | $1,050 | $4,550 |
Source: Public Records
Map
Nearby Homes
- 306 E Vine St
- 839 Saint Johns Ave
- 1147 S Union St
- 1189 S Main St
- 785 Holly St
- 720 S Metcalf St
- 600 Dingledine Ave
- 516 Catalpa Ave
- 711 W Kibby St
- 380 S Pine St
- 706 E Kibby St
- 520 Orena Ave
- 639 E 4th St
- 11 Unit Multi Family and Sfh
- 1008 Fairview Ave
- 640 E 4th St
- 1093 S Sugar St
- 426 S Baxter St
- 419 S Collett St
- 865 E 4th St
- 925 S Elizabeth St
- 933 S Elizabeth St
- 939 S Elizabeth St
- 919 S Elizabeth St
- 943 S Elizabeth St
- 932 S Elizabeth St
- 951 S Elizabeth St
- 940 S Main St
- 903 S Elizabeth St
- 928 S Elizabeth St
- 924 S Elizabeth St
- 938 S Elizabeth St
- 115 W Vine St
- 117 W Vine St
- 936 S Main St
- 906-908 S Elizabeth St
- 906 S Elizabeth St
- 900 S Main St
- 902 S Elizabeth St